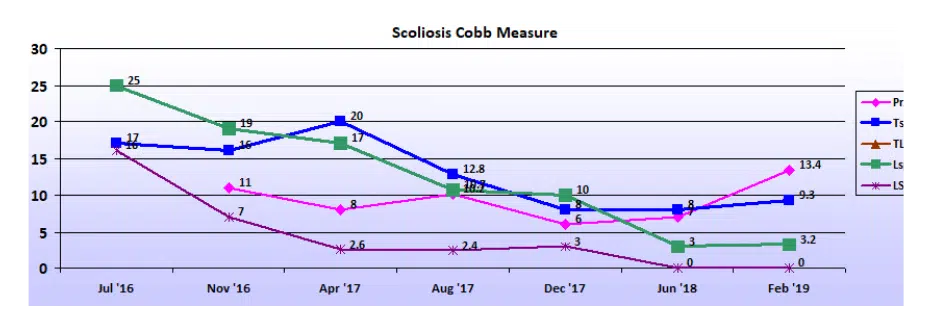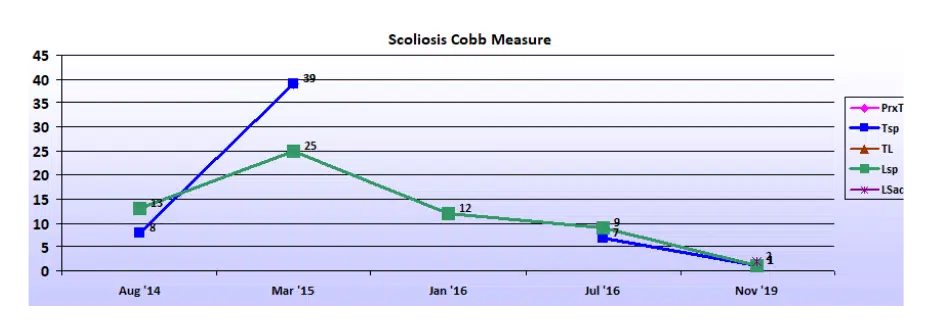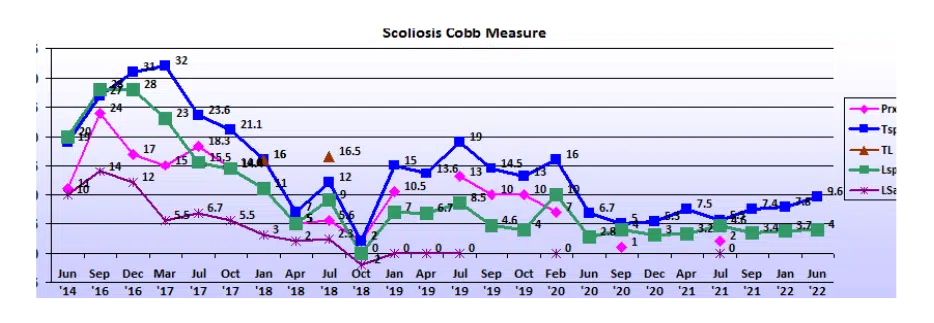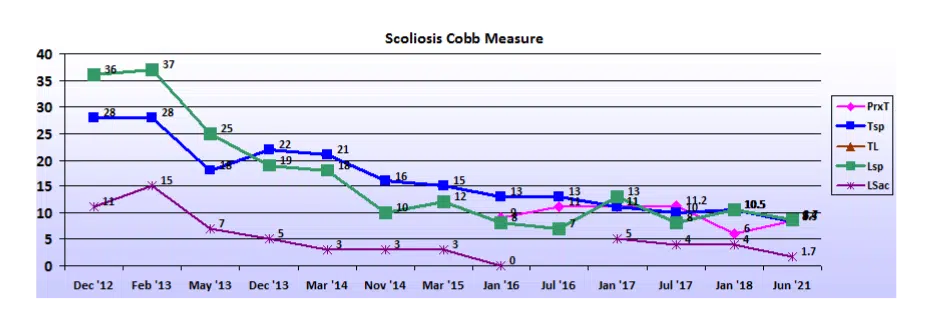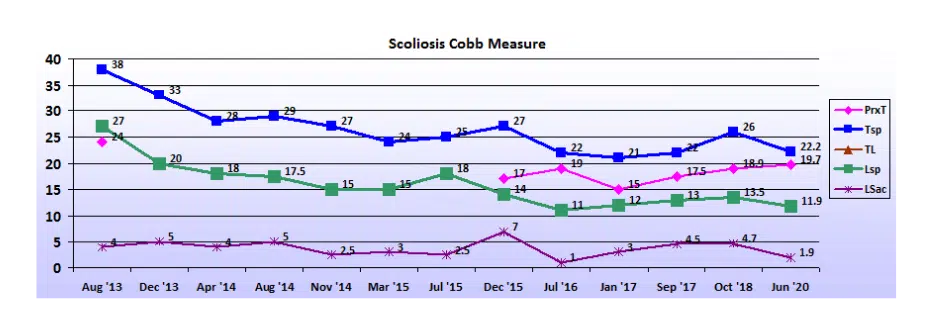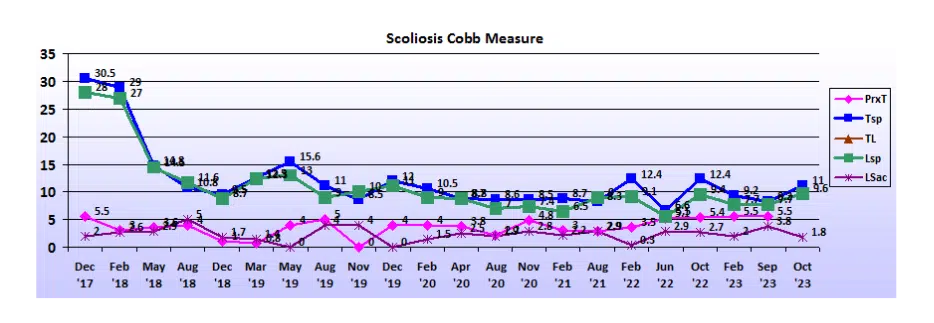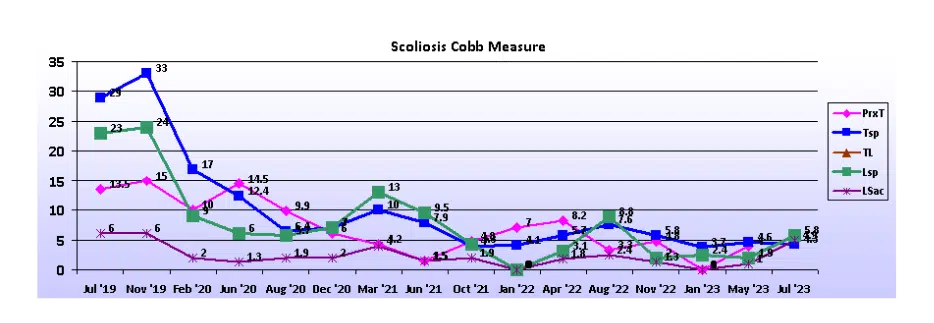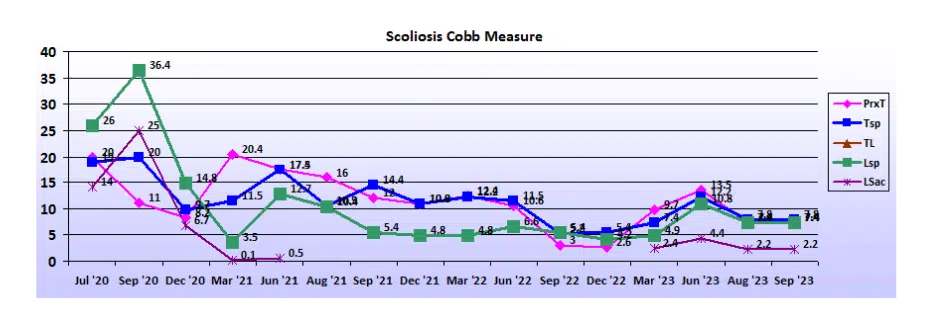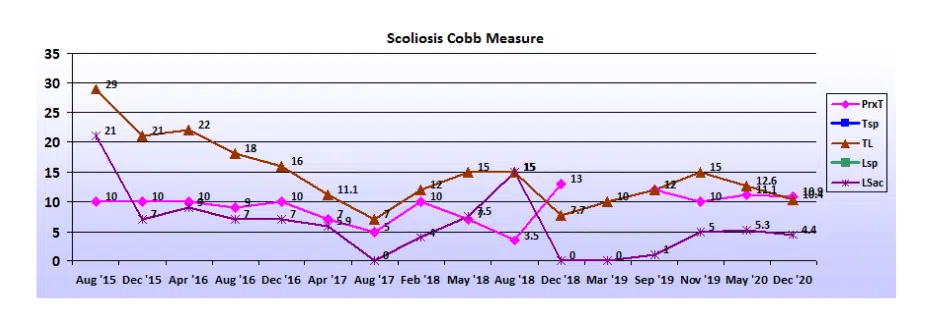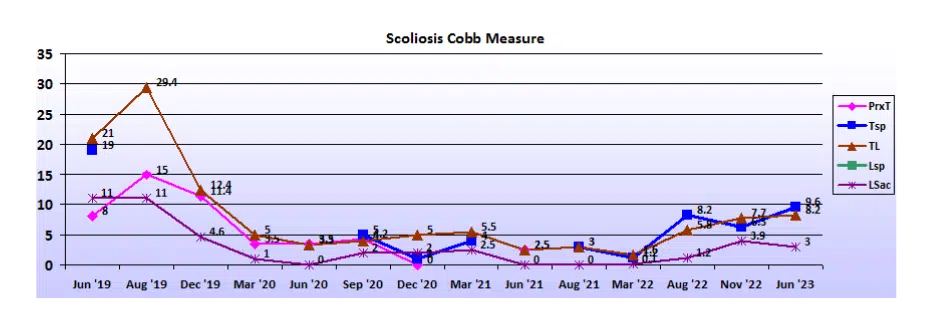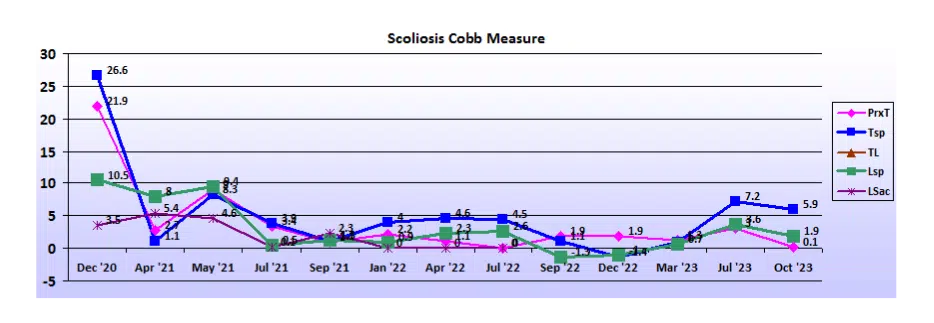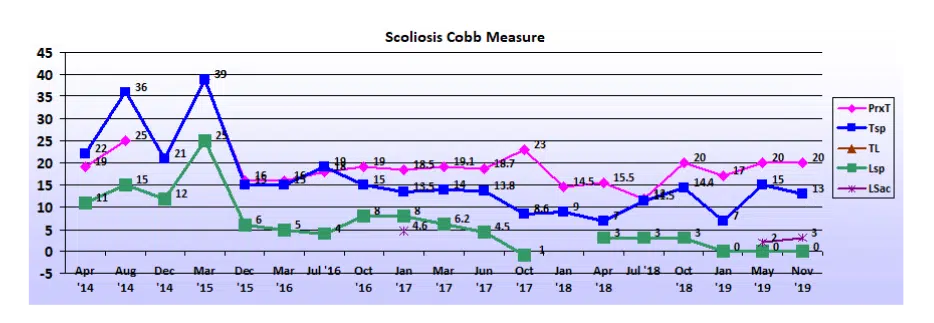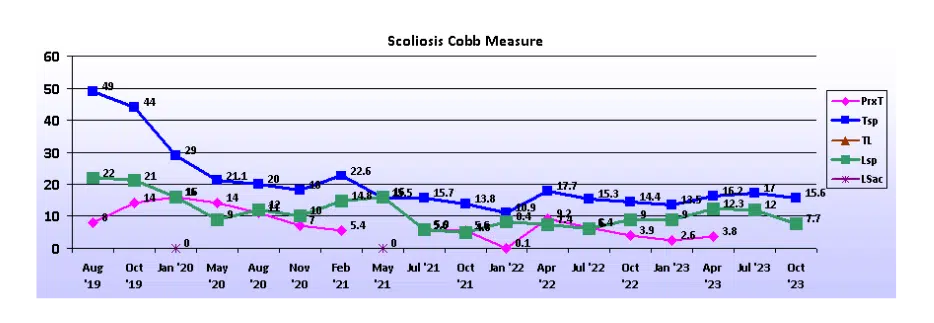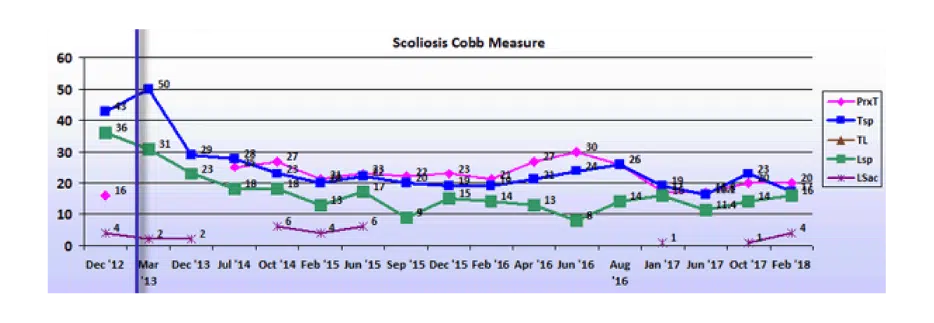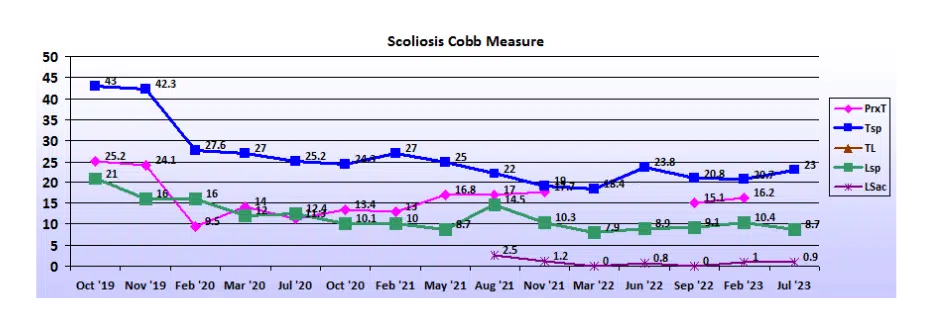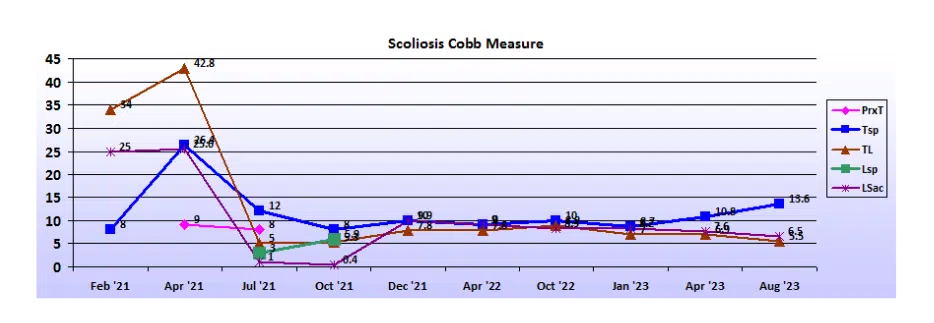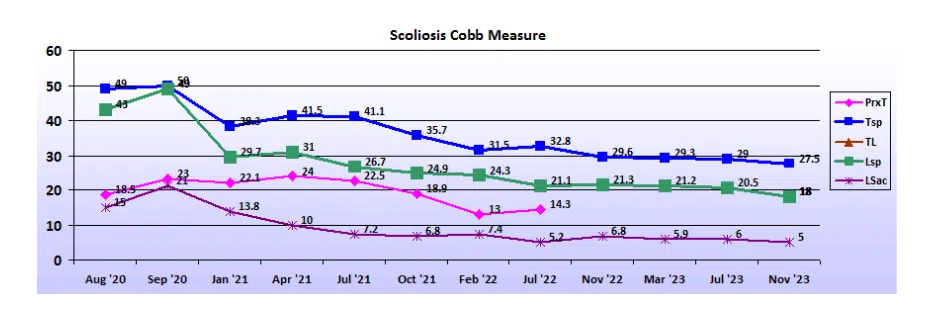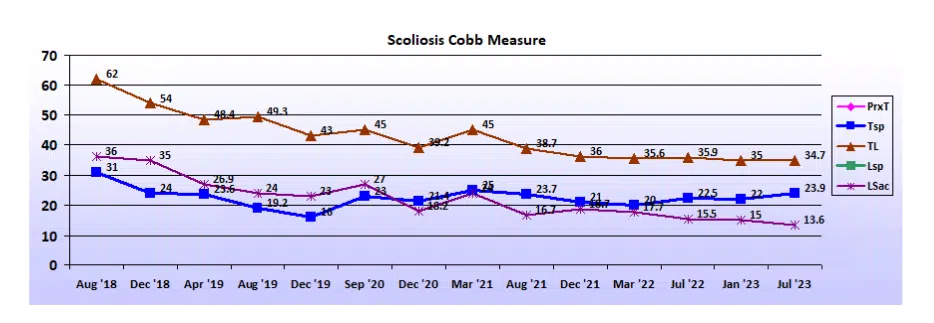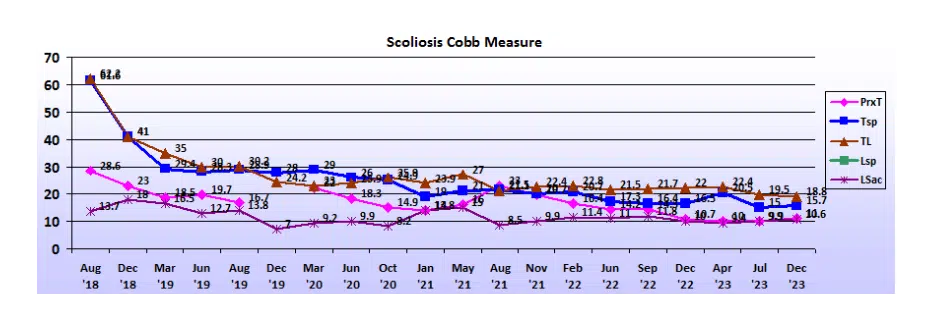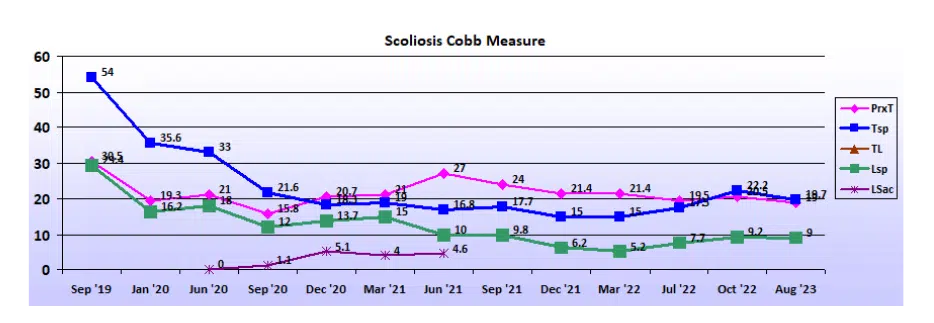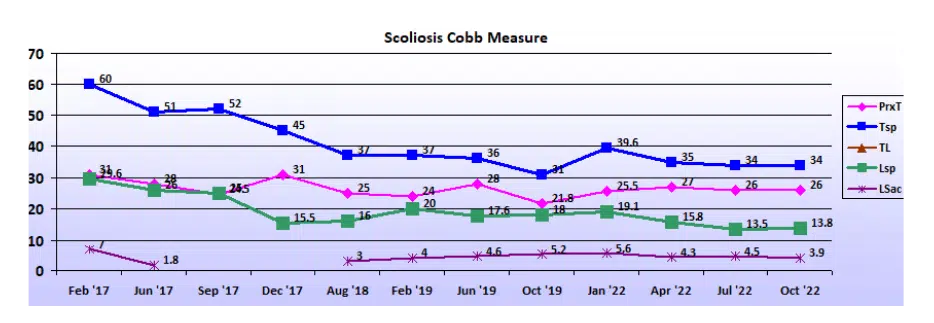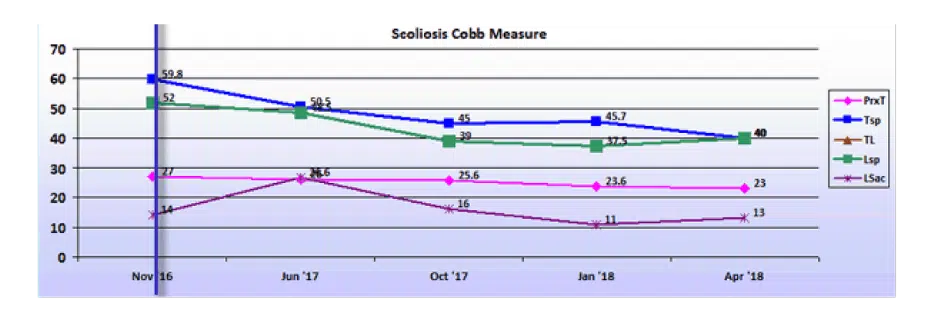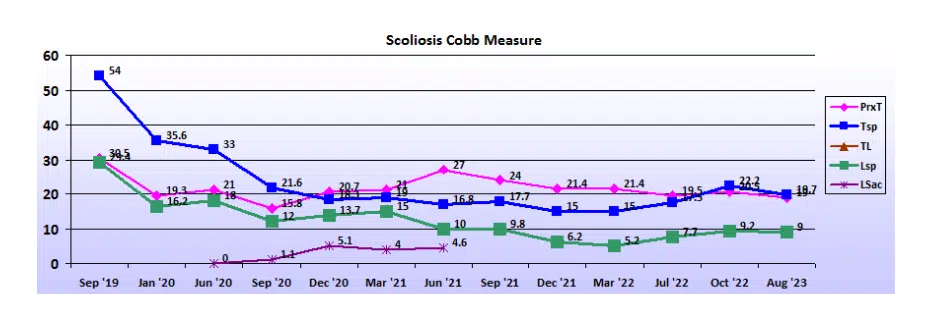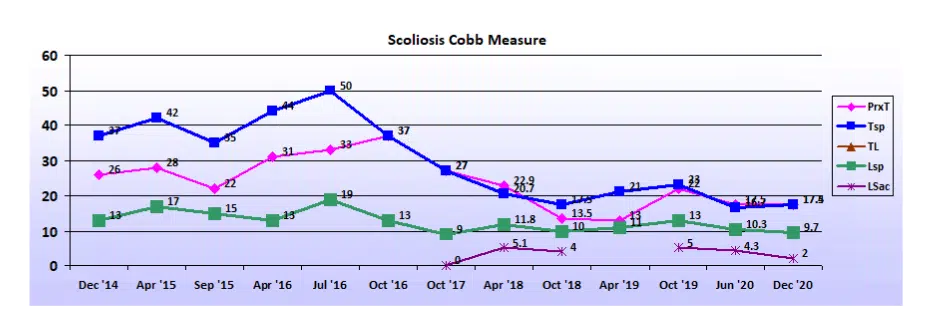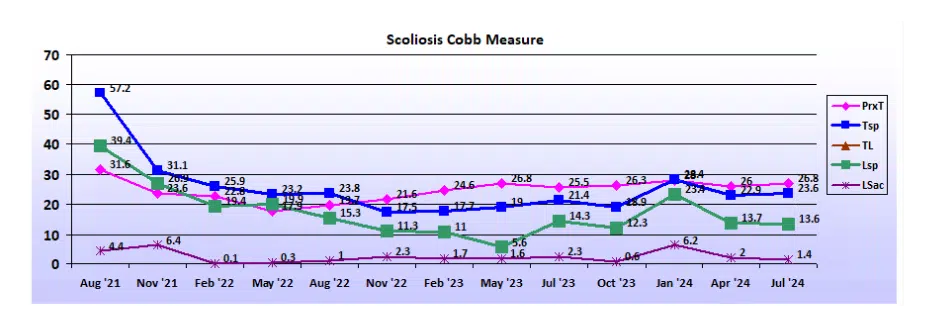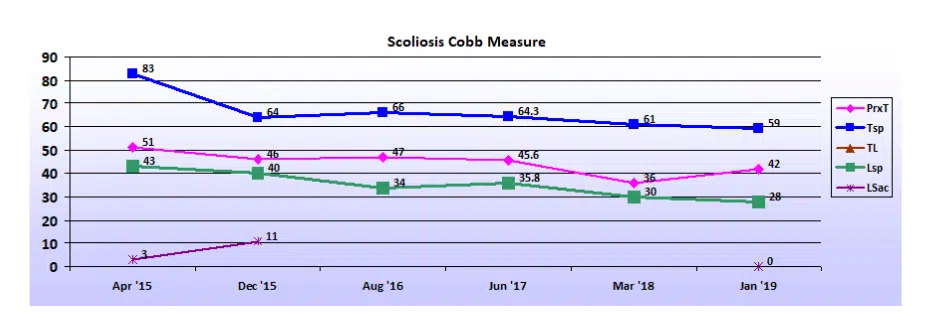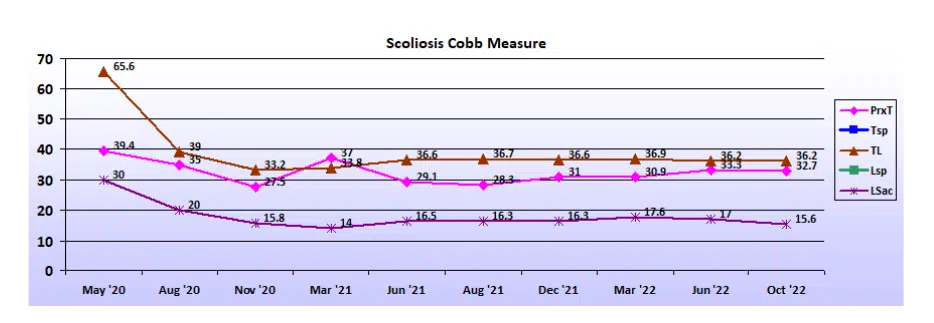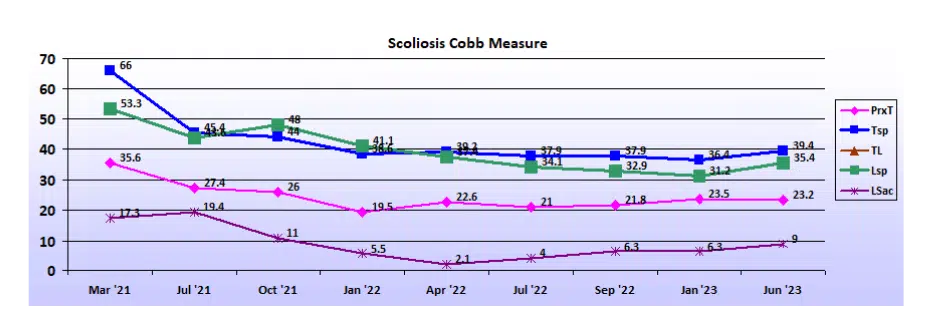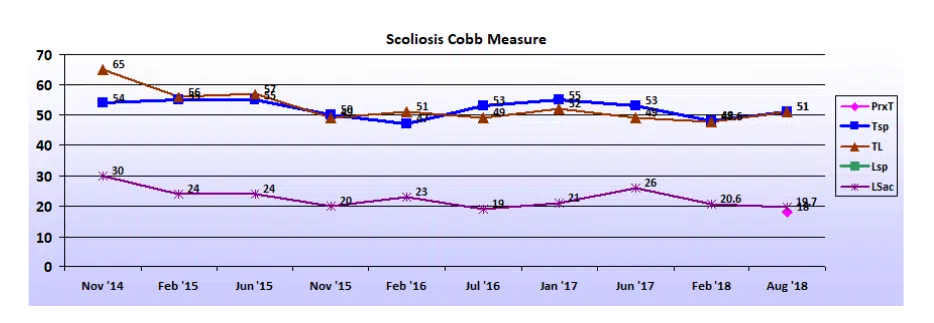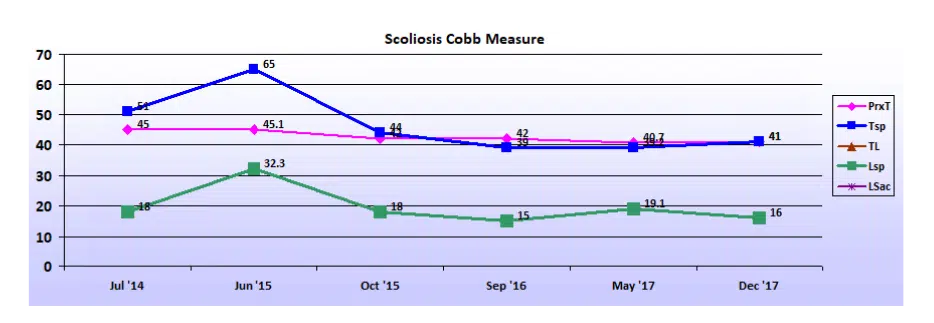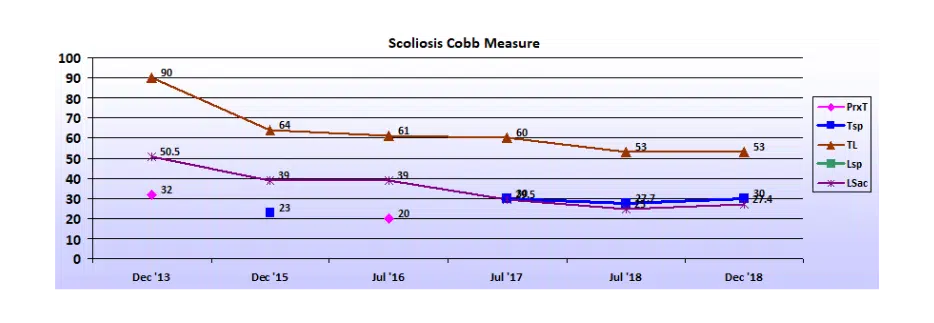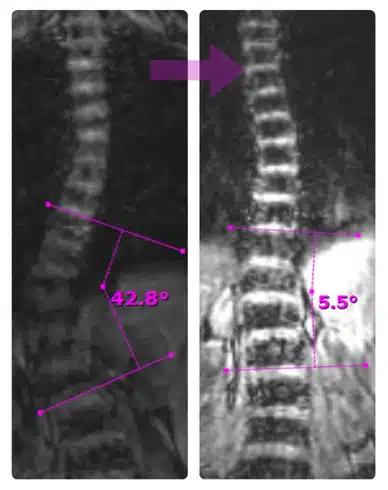
Scoliosis varies in degree and type, which means each case requires a unique approach to treatment. This section outlines the expected success rates, average reductions, and case studies for various curve based on your childs current curve size. This will help you understand the range of treatment results for similar cases.
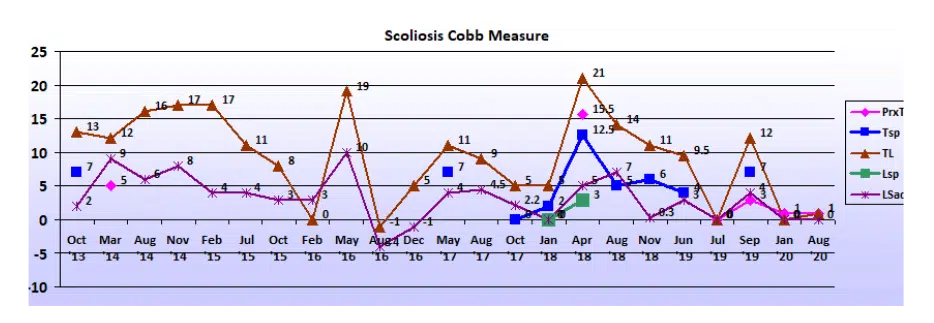
Select your childs current curve range:

Category: 10-24°
Success Rate:
100%
Success Rate Defined:
– The percentage of cases in this category that were prevented from progressing to surgical range (40 degrees)
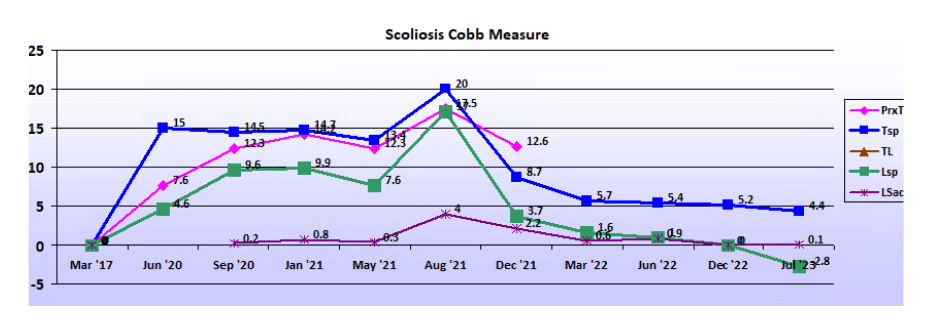
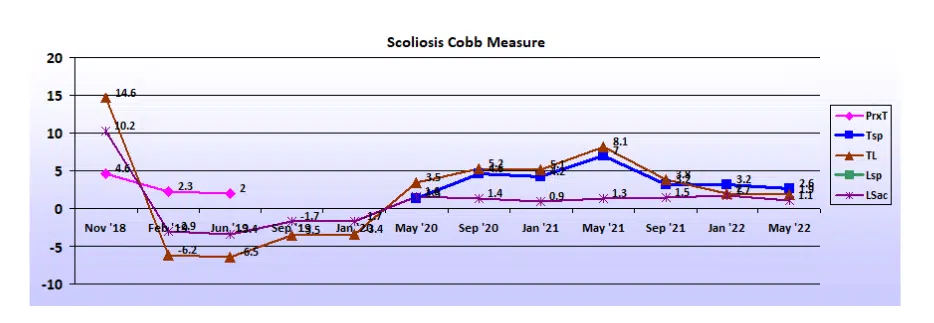
Average Reduction:
47%
Avg Reduction Defined:
– The average of ALL patients who started the program, not filtered for compliance. This includes patients who worked hard and those who did not
Our Best Reduction:
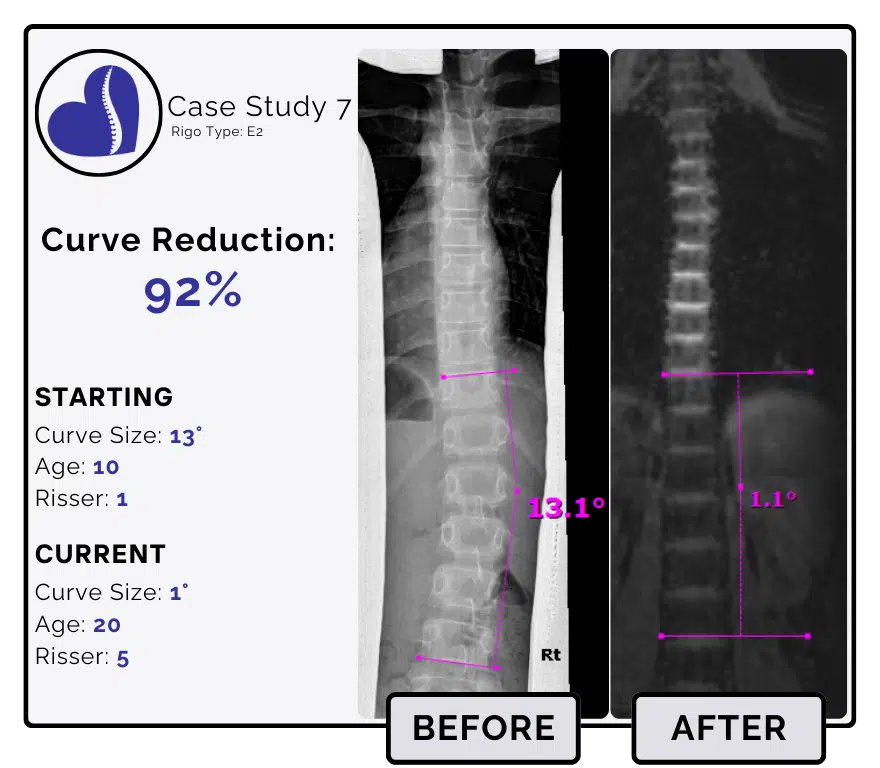
92%
Best Reduction Defined:
– Our largest percent reduction on record for cases that began with a Cobb Angle between 10 to 24 degrees.
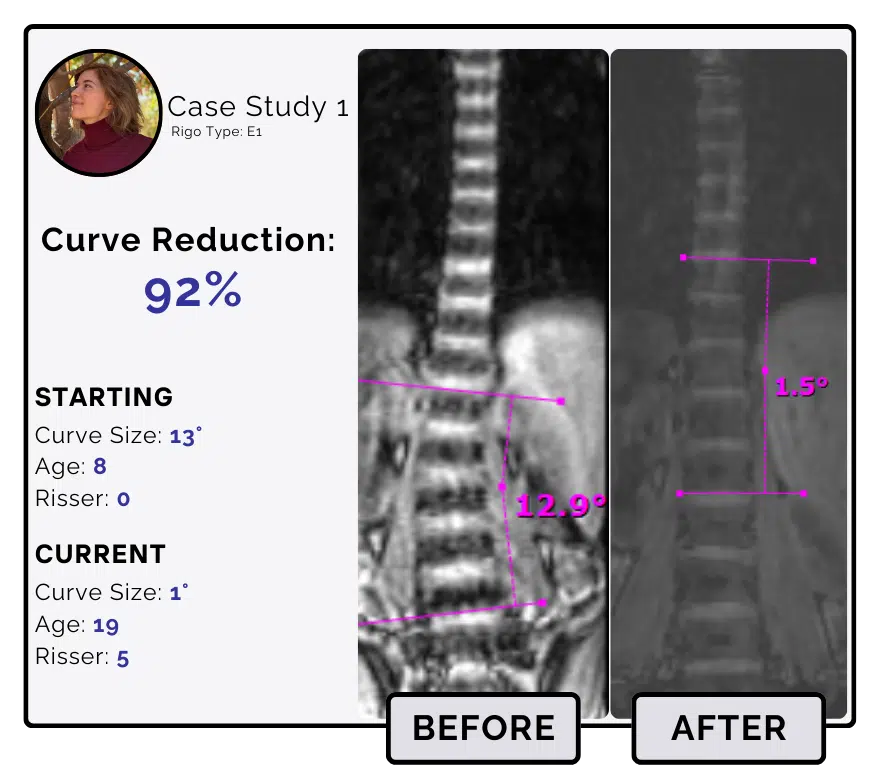
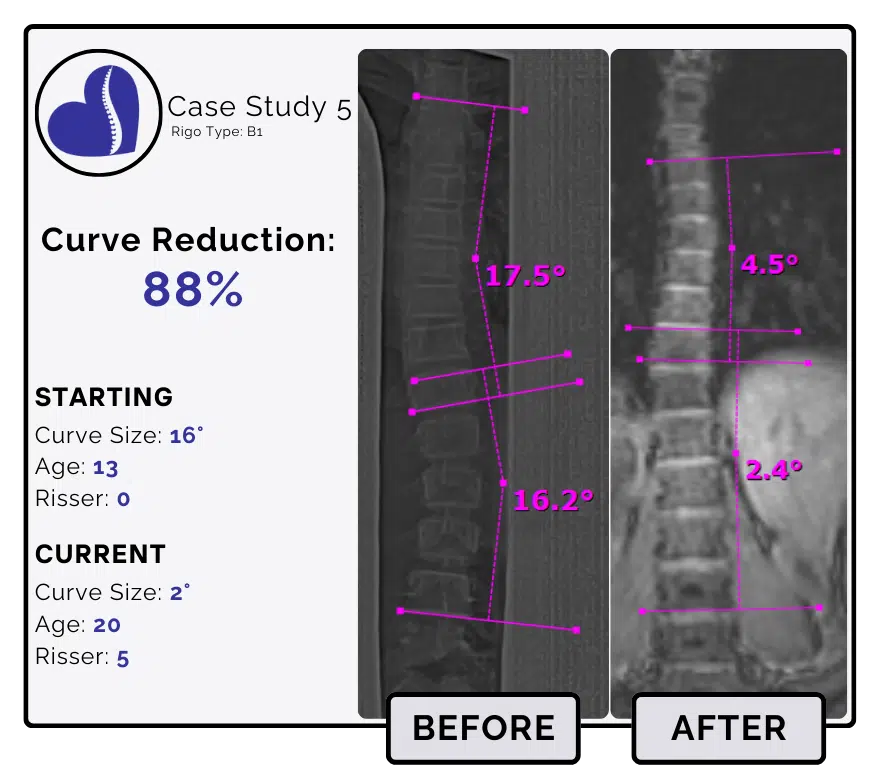
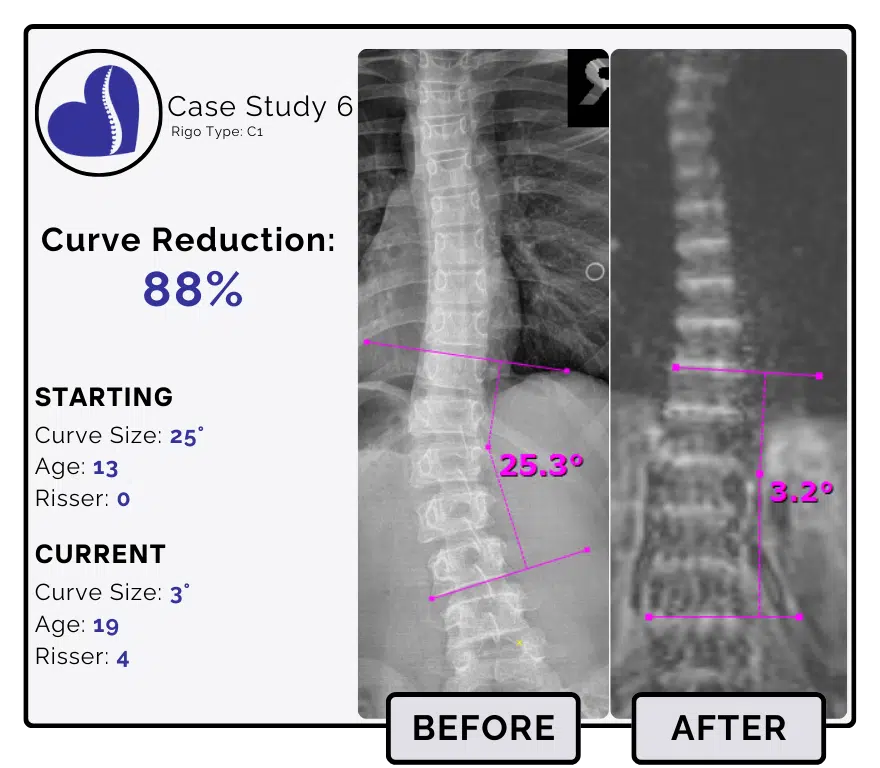
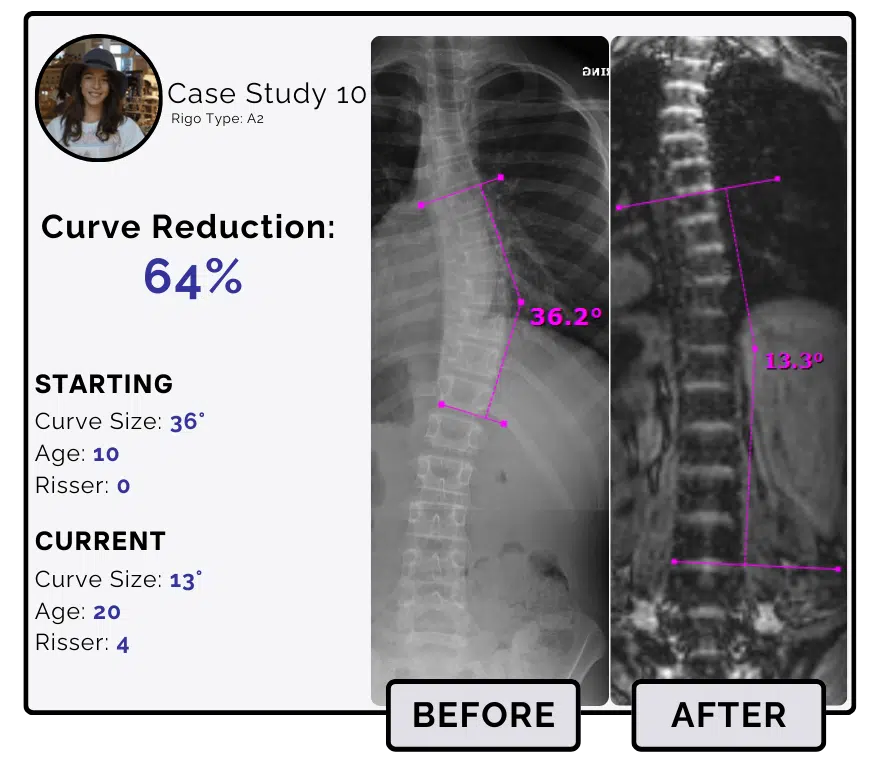
Before and after scoliosis treatment showing 13-degree curve reduction with detailed starting and current info, including percentage of curve reduction and comparison images.
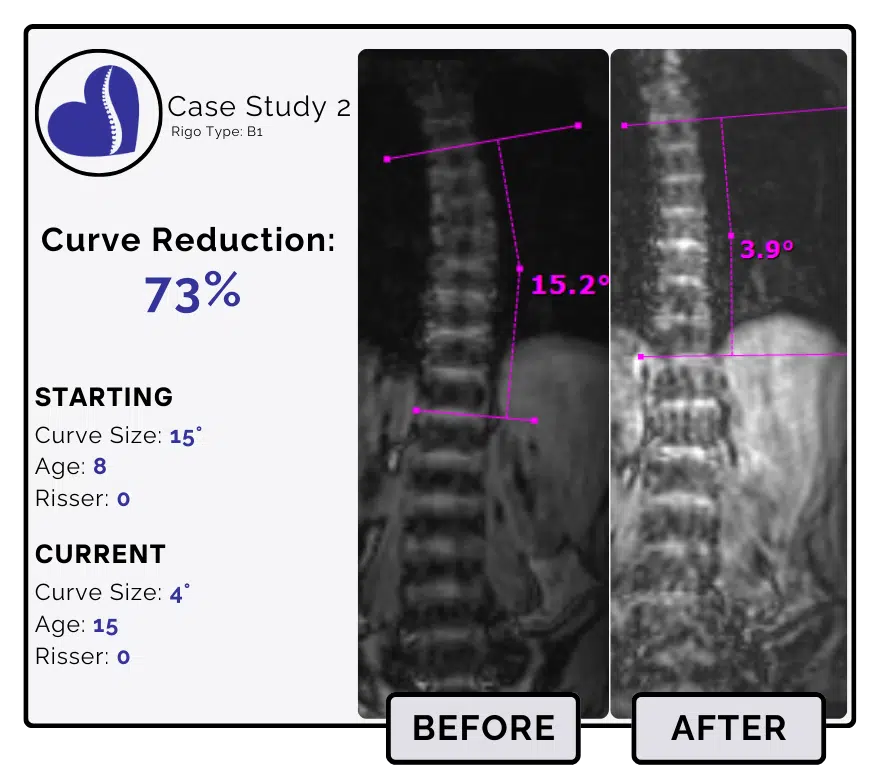
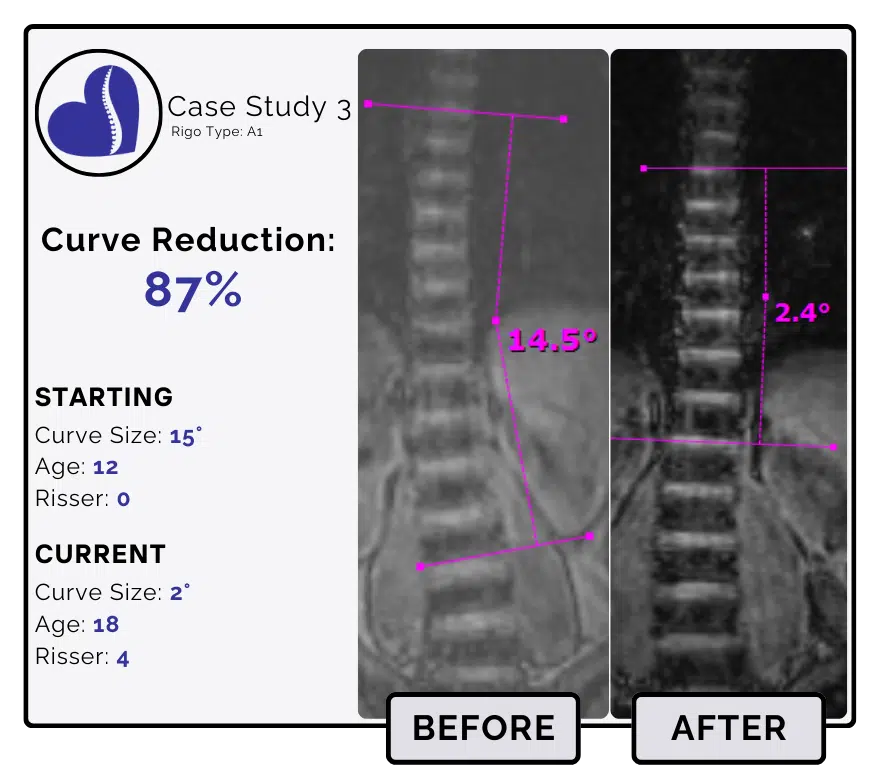
Before and after scoliosis treatment showing 15-degree curve reduction with detailed starting and current info, including percentage of curve reduction and comparison images.
Category: 25-39°
Success Rate:
98%
Success Rate Defined:
– The percentage of cases in this category that were prevented from progressing to surgical range (40 degrees)
Average Reduction:
36%
Avg Reduction Defined:
– The average of ALL patients who started the program, not filtered for compliance. This includes patients who worked hard and those who did not
Our Best Reduction:
78%
Best Reduction Defined:
– Our largest percent reduction on record for cases that began with a Cobb Angle between 25 to 39 degrees.
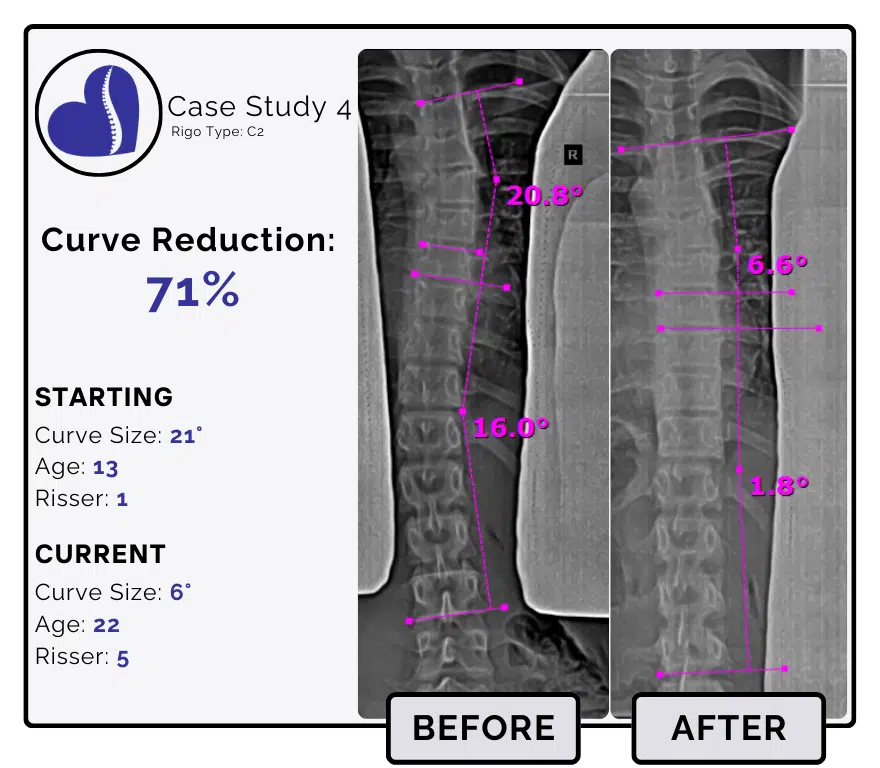
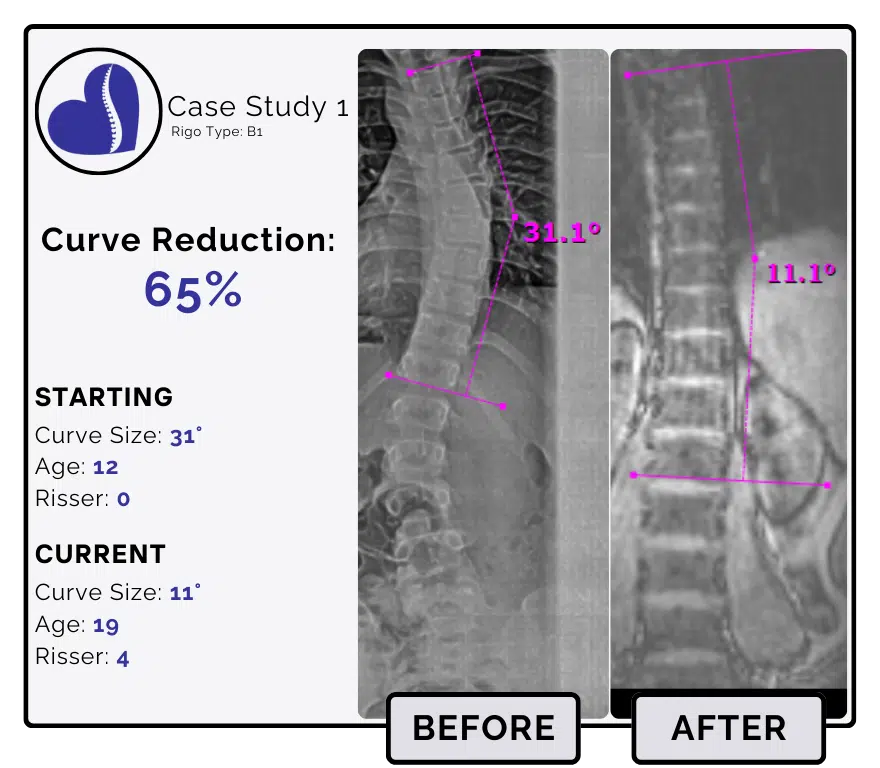
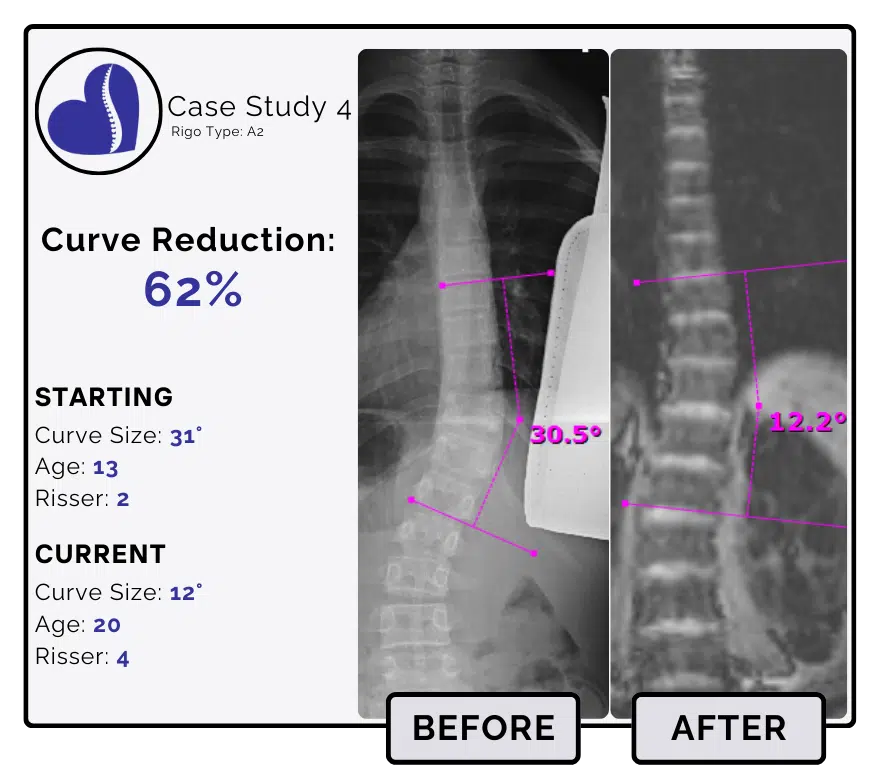
Before and after scoliosis treatment showing 31-degree curve reduction with detailed starting and current info, including percentage of curve reduction and comparison images.
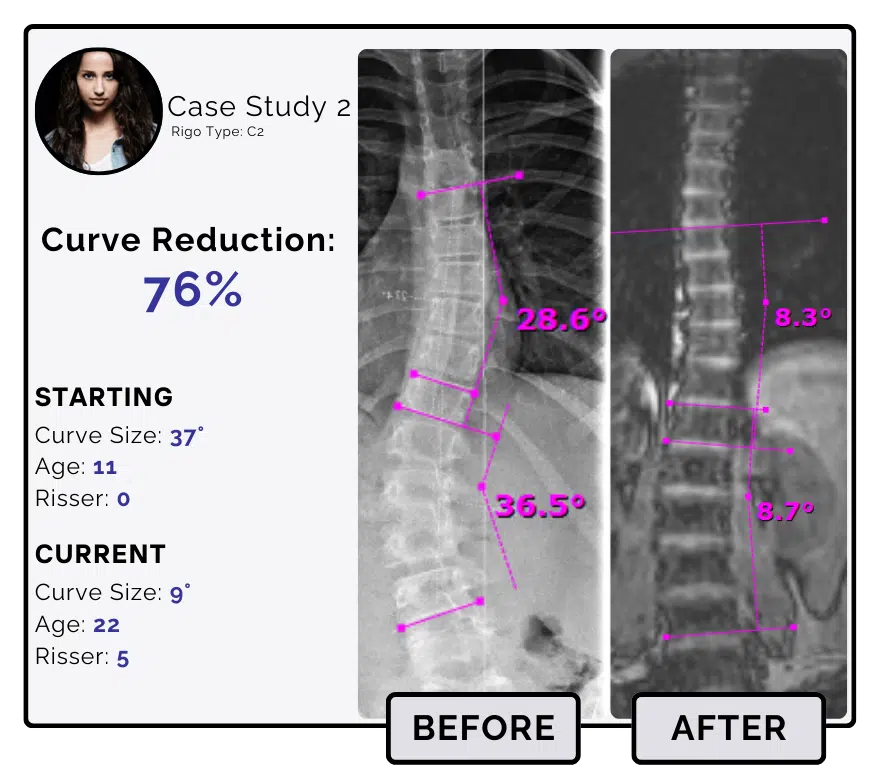
Before and after scoliosis treatment showing 37-degree curve reduction with detailed starting and current info, including percentage of curve reduction and comparison images.
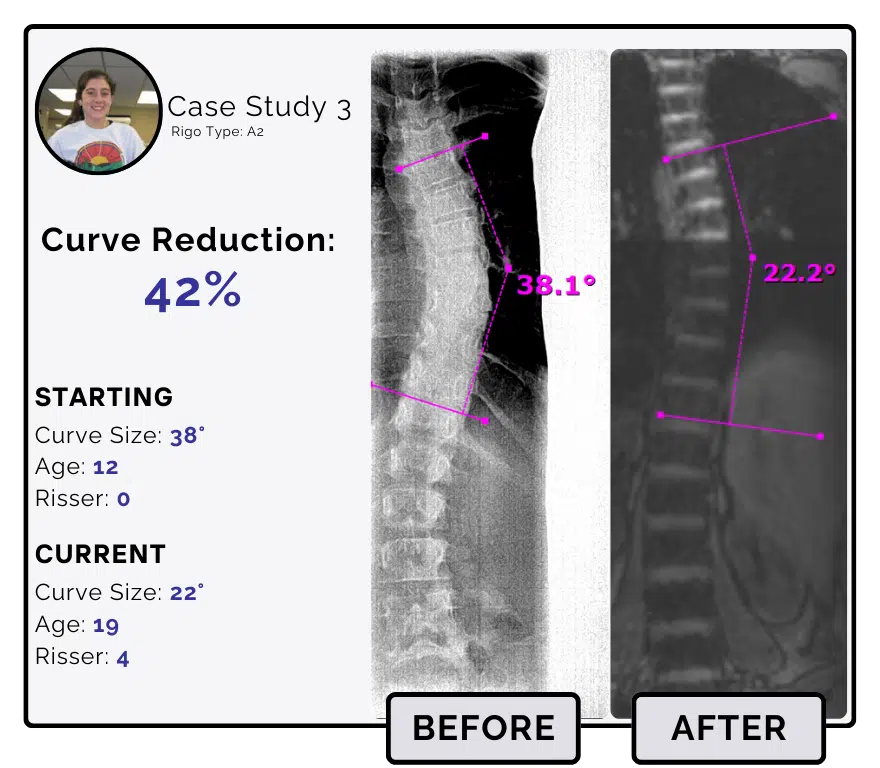
Before and after scoliosis treatment showing 38-degree curve reduction with detailed starting and current info, including percentage of curve reduction and comparison images.
Before and after scoliosis treatment showing 31-degree curve reduction with detailed starting and current info, including percentage of curve reduction and comparison images.
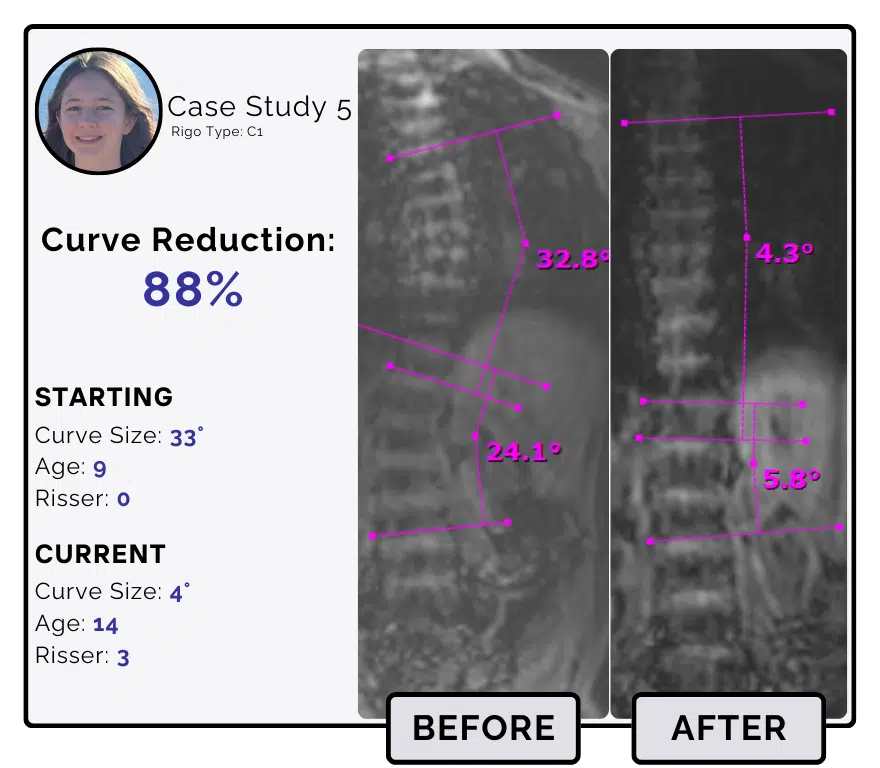
Before and after scoliosis treatment showing 33-degree curve reduction with detailed starting and current info, including percentage of curve reduction and comparison images.
Before and after scoliosis treatment showing 36-degree curve reduction with detailed starting and current info, including percentage of curve reduction and comparison images.
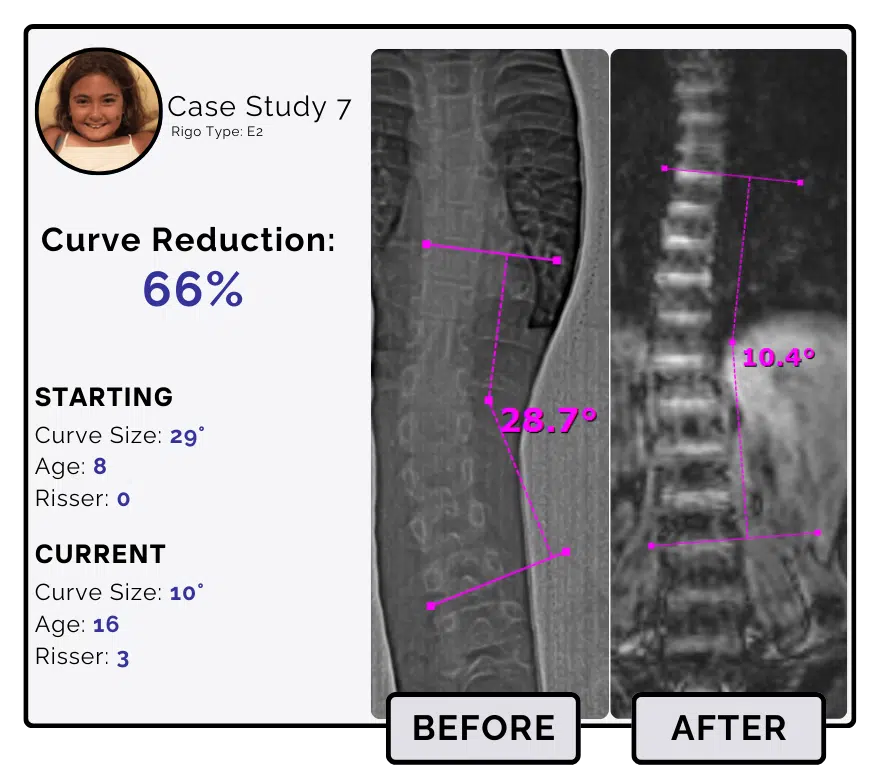
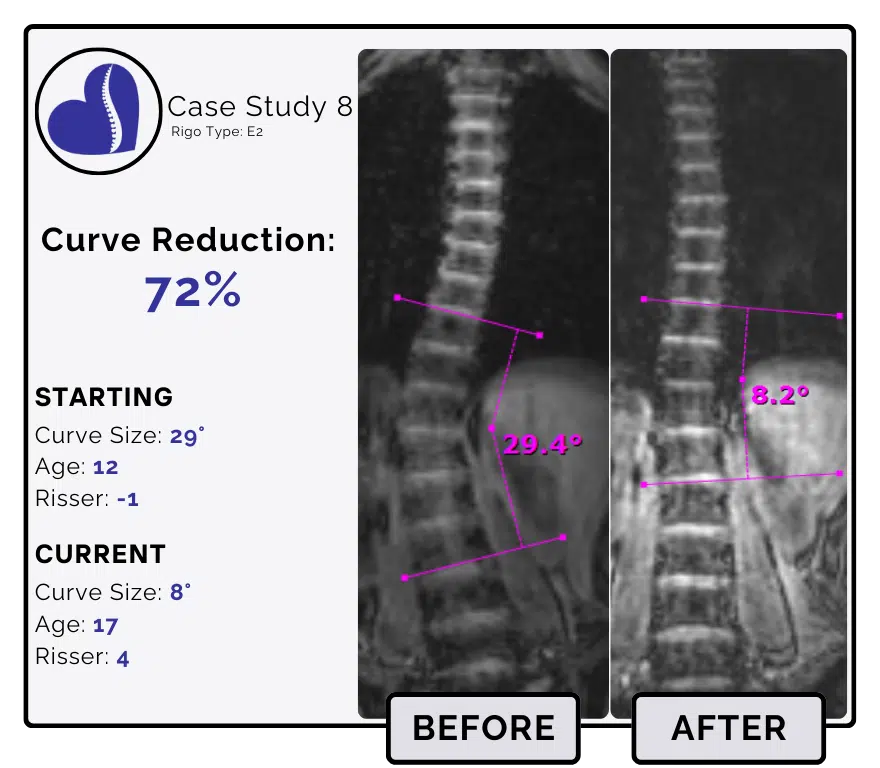
Before and after scoliosis treatment showing 29-degree curve reduction with detailed starting and current info, including percentage of curve reduction and comparison images.
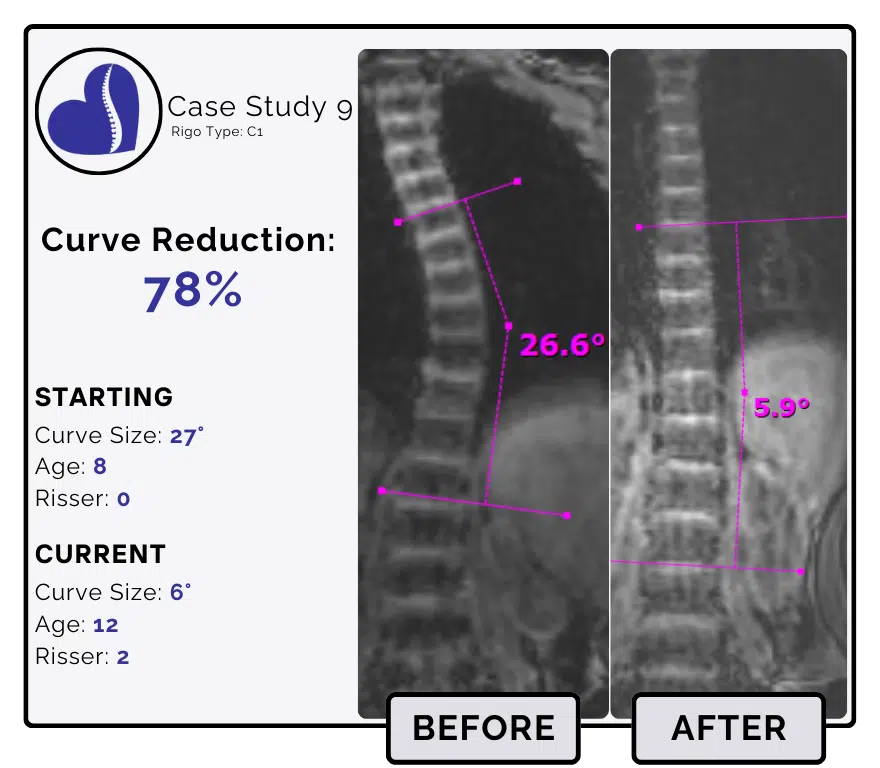
Before and after scoliosis treatment showing 27-degree curve reduction with detailed starting and current info, including percentage of curve reduction and comparison images.
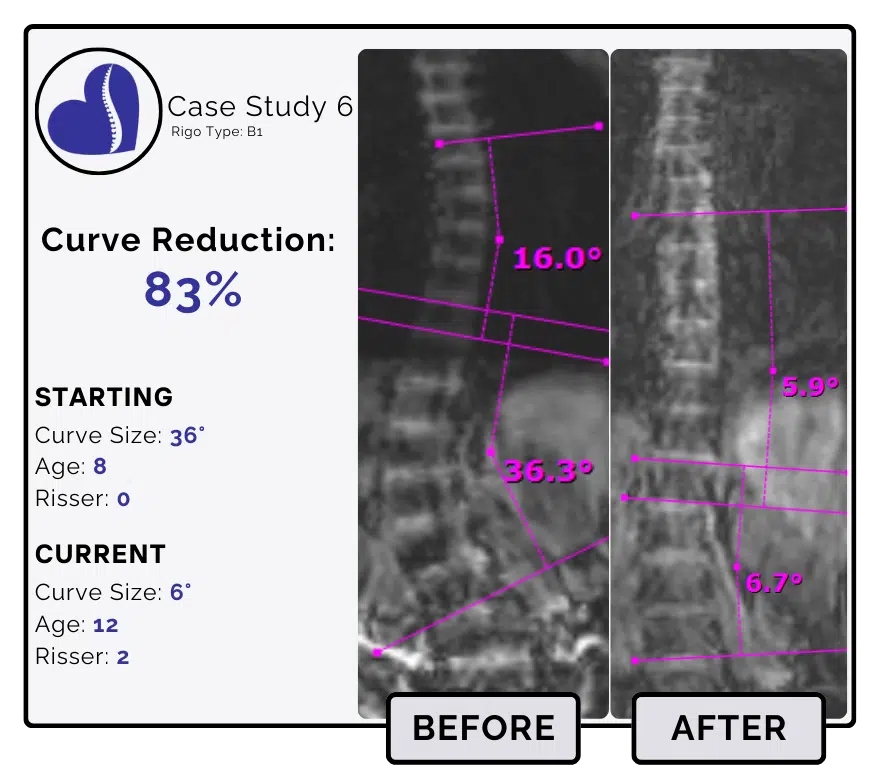
Before and after scoliosis treatment showing 36-degree curve reduction with detailed starting and current info, including percentage of curve reduction and comparison images.
Category: 40-50°
Success Rate:
78%
Success Rate Defined:
– The percentage of cases in this category that were prevented from progressing further in surgical range
Average Reduction:
32%
Avg Reduction Defined:
– The average of ALL patients who started the program, not filtered for compliance. This includes patients who worked hard and those who did not
Our Best Reduction:
76%
Best Reduction Defined:
– Our largest percent reduction on record for cases that began with a Cobb Angle between 40 to 50 degrees.
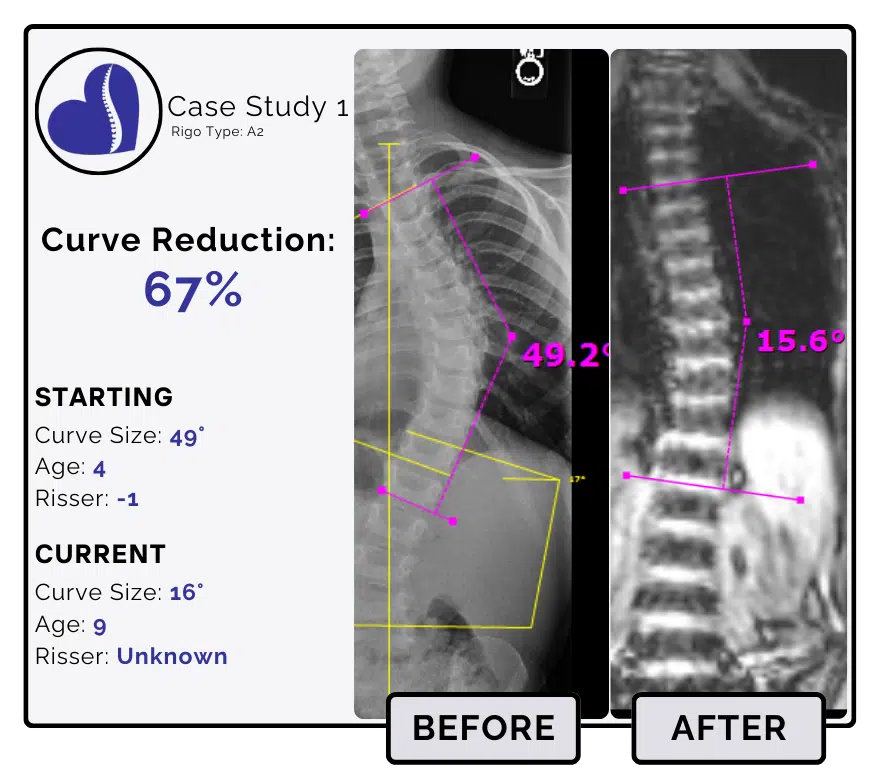
Before and after scoliosis treatment showing 49-degree curve reduction with detailed starting and current info, including percentage of curve reduction and comparison images.
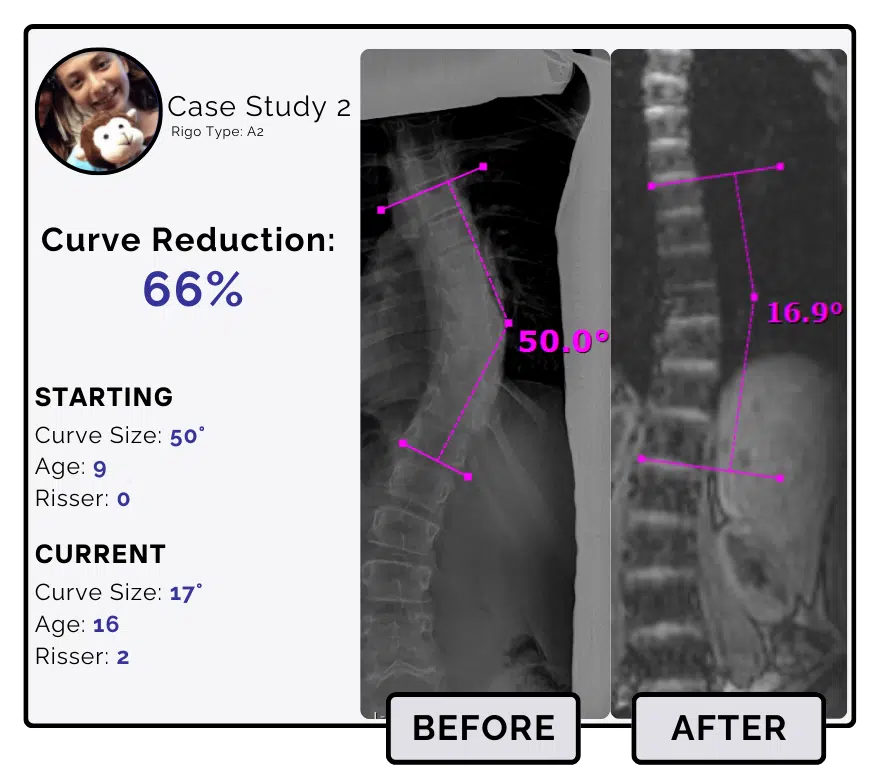
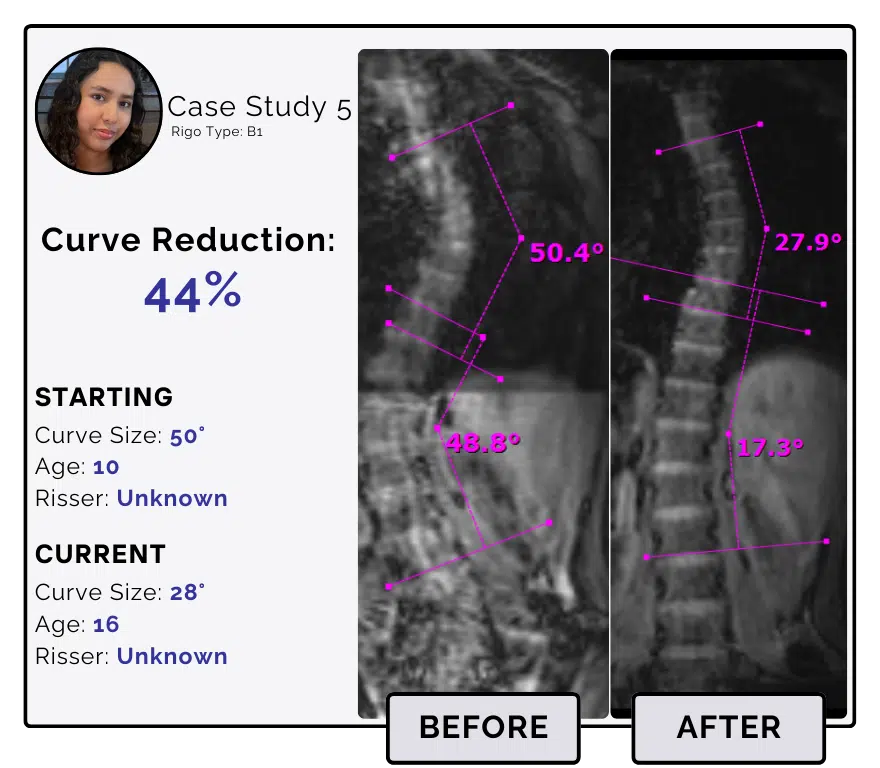
Before and after scoliosis treatment showing 50-degree curve reduction with detailed starting and current info, including percentage of curve reduction and comparison images.
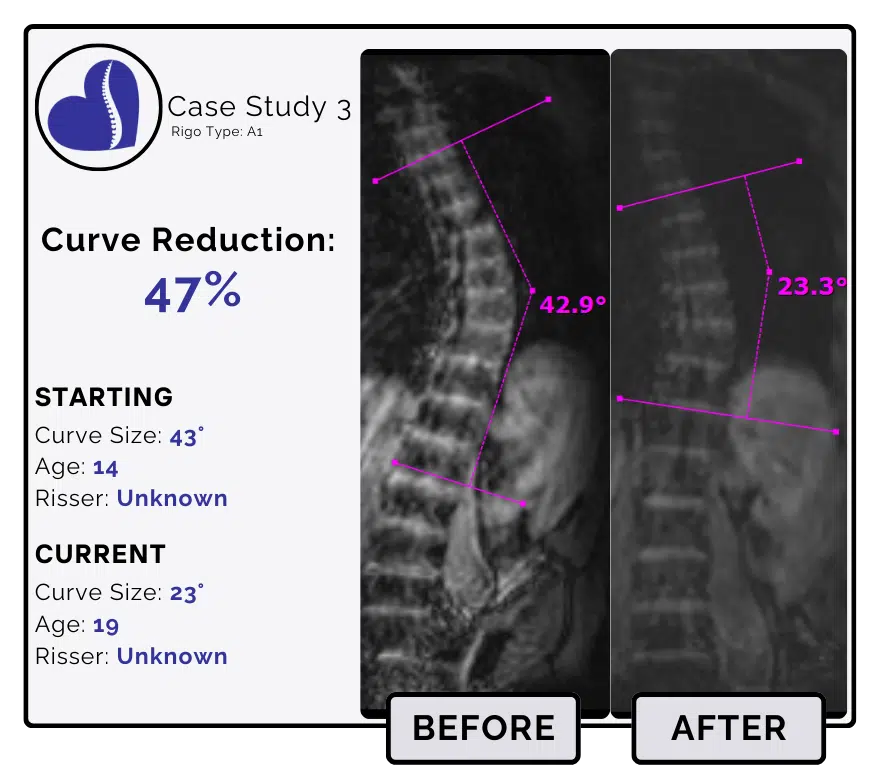
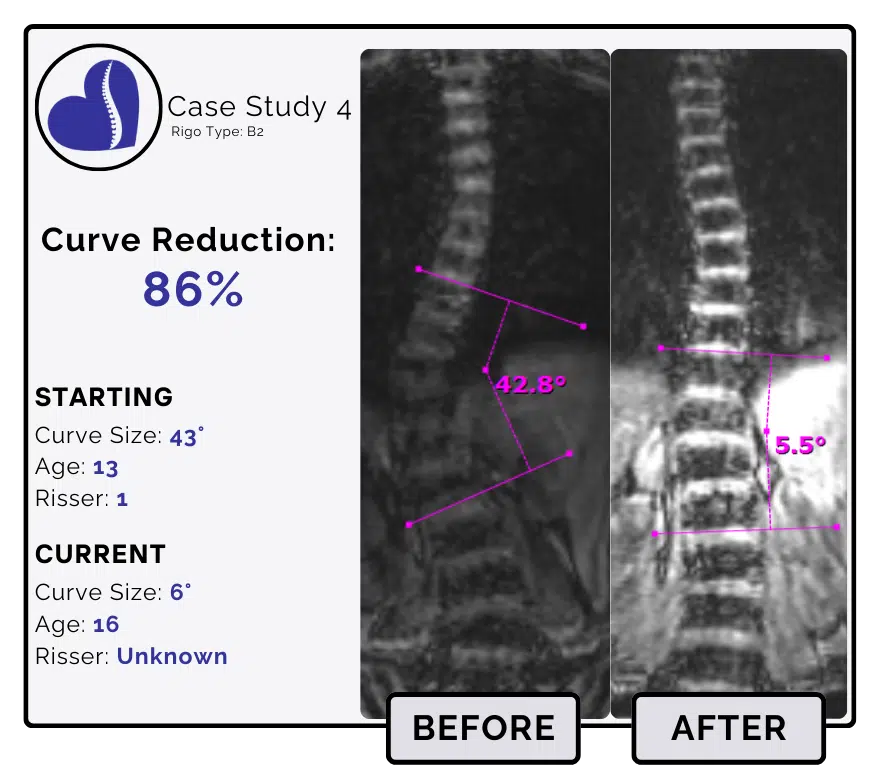
Before and after scoliosis treatment showing 43-degree curve reduction with detailed starting and current info, including percentage of curve reduction and comparison images.
Before and after scoliosis treatment showing 50-degree curve reduction with detailed starting and current info, including percentage of curve reduction and comparison images.
Category: 51-64°
Success Rate:
66%
Success Rate Defined:
– The percentage of cases in this category that were prevented from progressing further in surgical range
Average Reduction:
19%
Avg Reduction Defined:
– The average of ALL patients who started the program, not filtered for compliance. This includes patients who worked hard and those who did not
Our Best Reduction:
51%
Best Reduction Defined:
– Our largest percent reduction on record for cases that began with a Cobb Angle between 51 to 64 degrees.
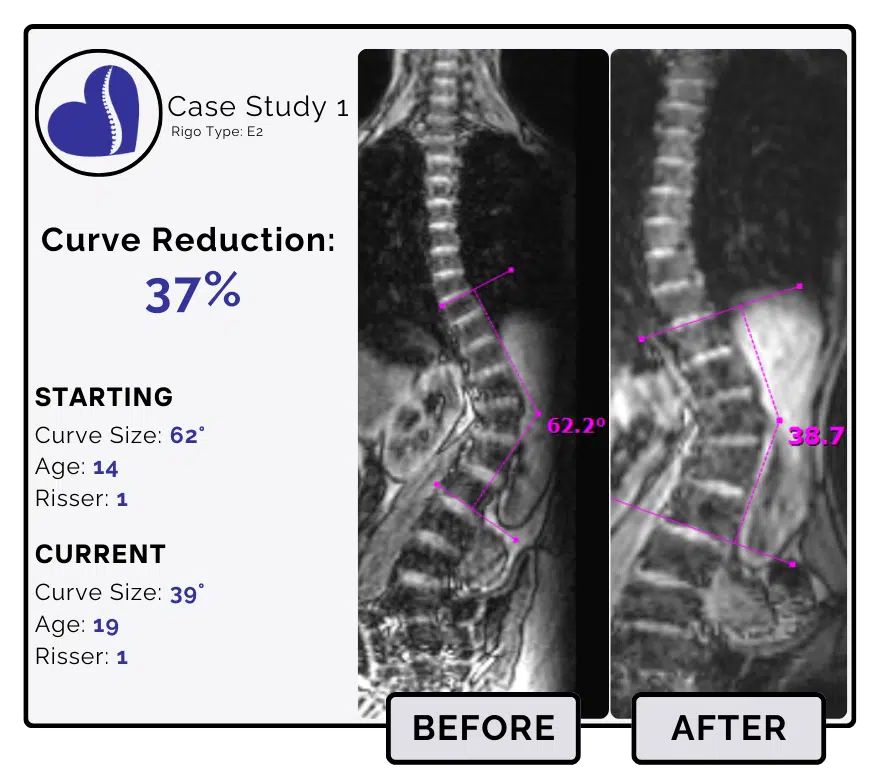
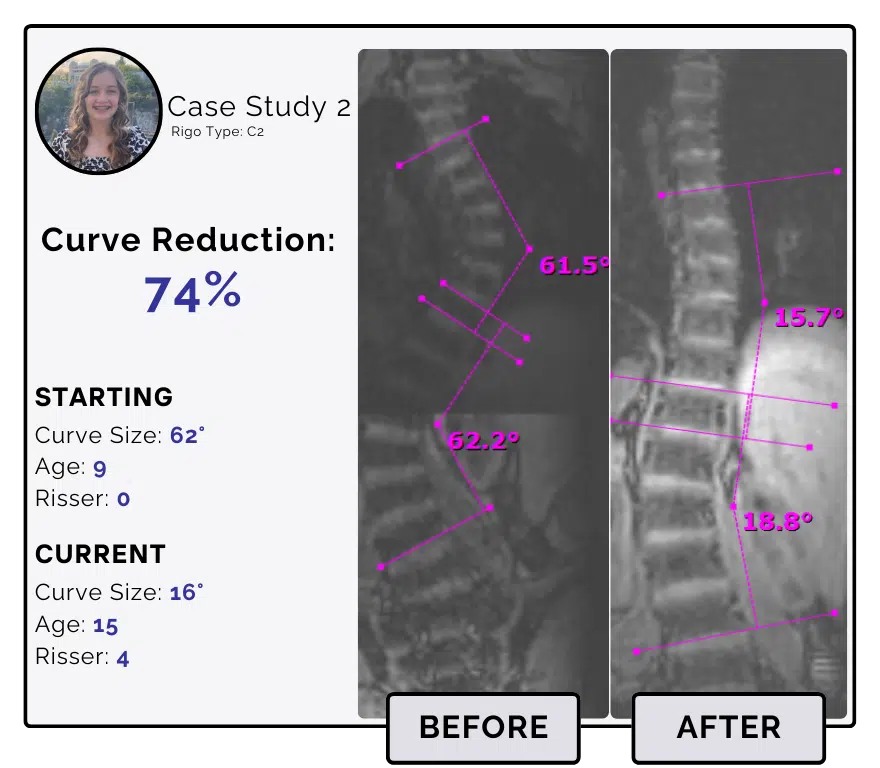
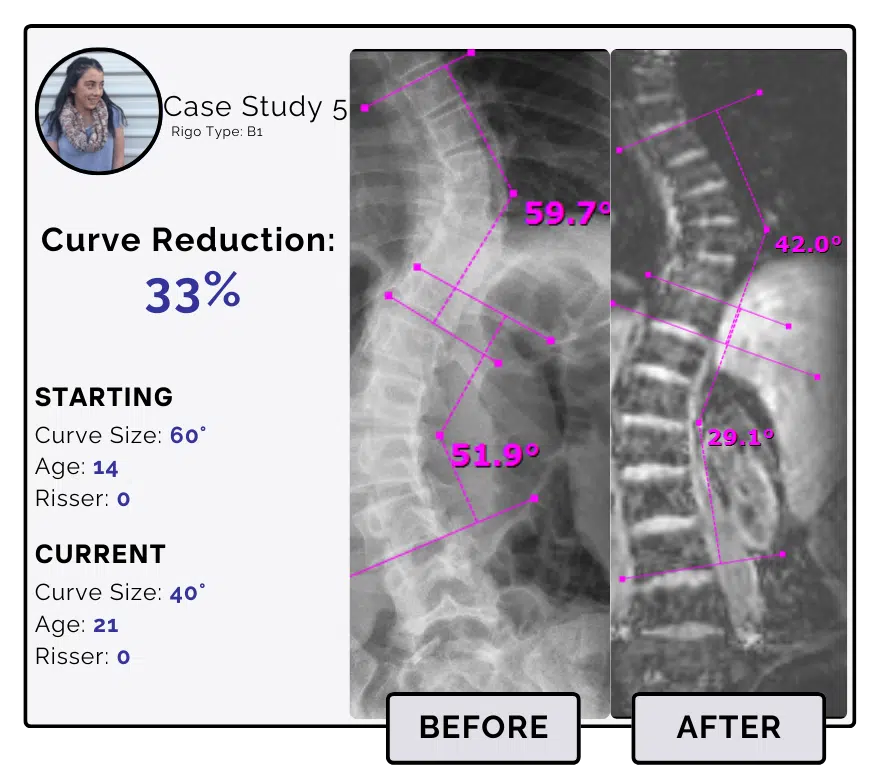
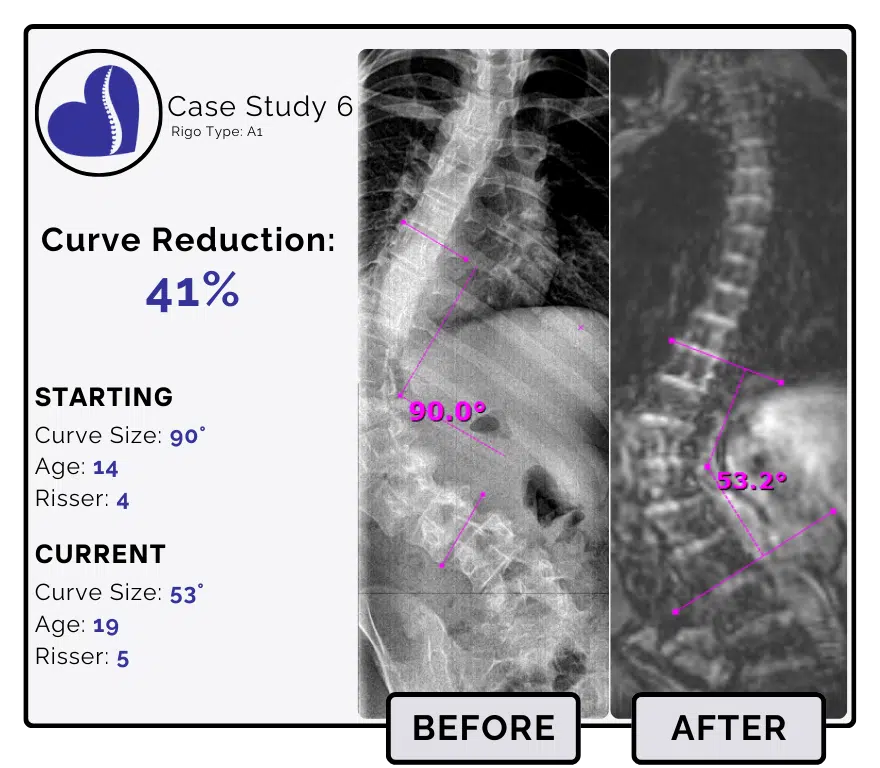
Before and after scoliosis treatment showing 62-degree curve reduction with detailed starting and current info, including percentage of curve reduction and comparison images.
32-Degree Scoliosis Curve Reduction: Before and After Treatment
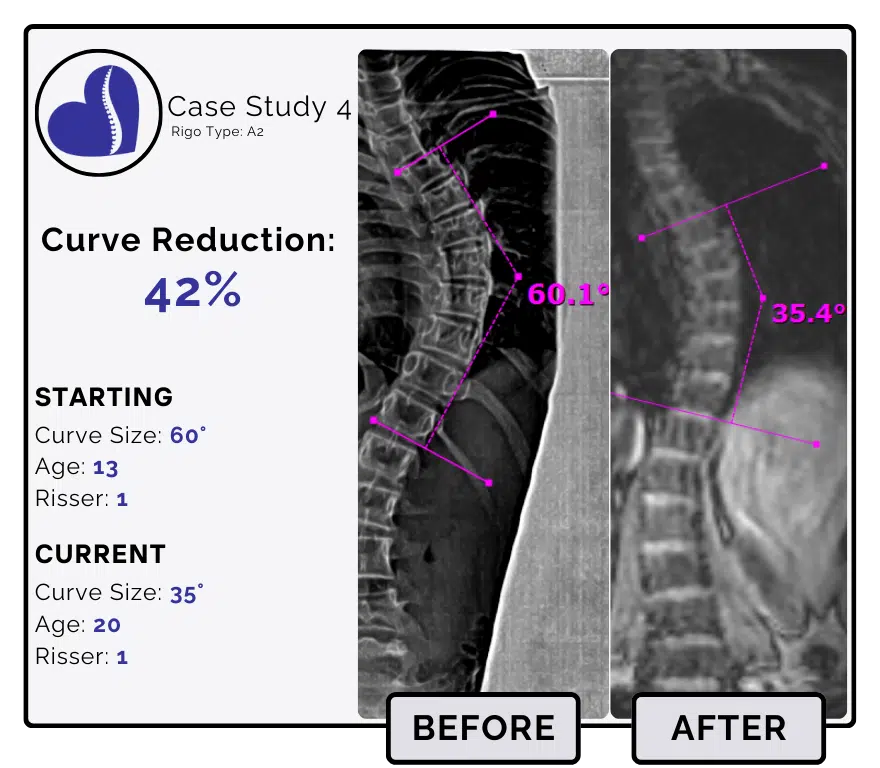
Before and after scoliosis treatment showing 60-degree curve reduction with detailed starting and current info, including percentage of curve reduction and comparison images.
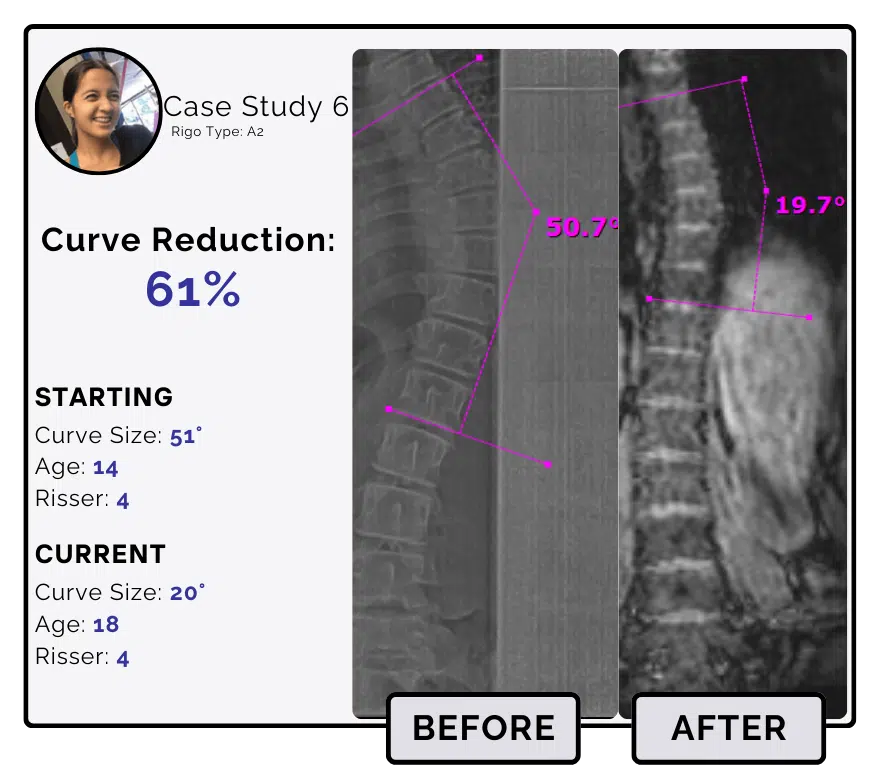
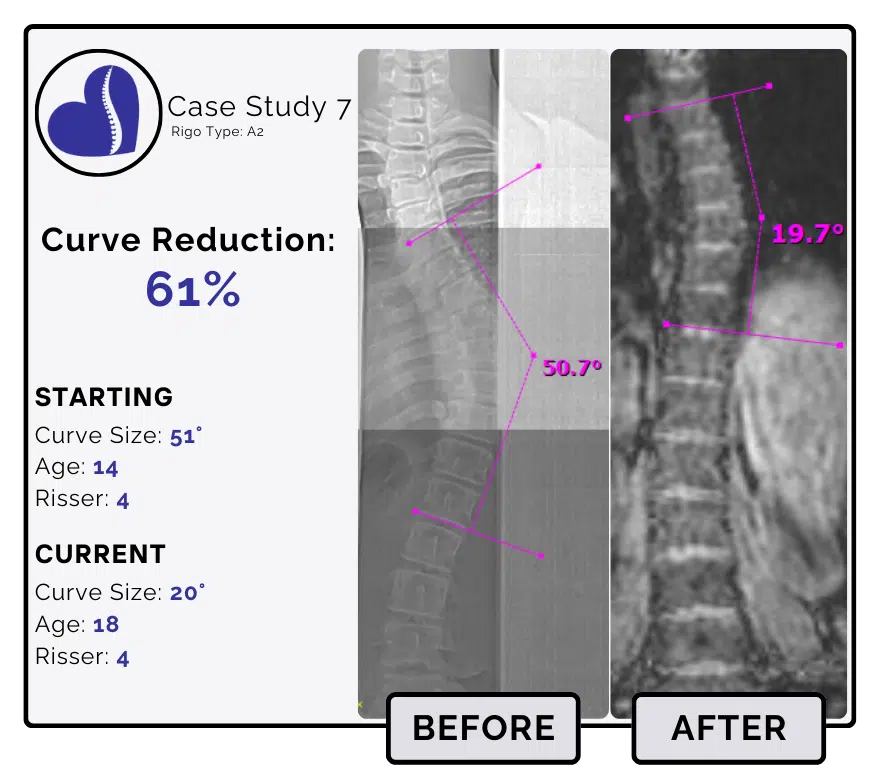
Before and after scoliosis treatment showing 51-degree curve reduction with detailed starting and current info, including percentage of curve reduction and comparison images.
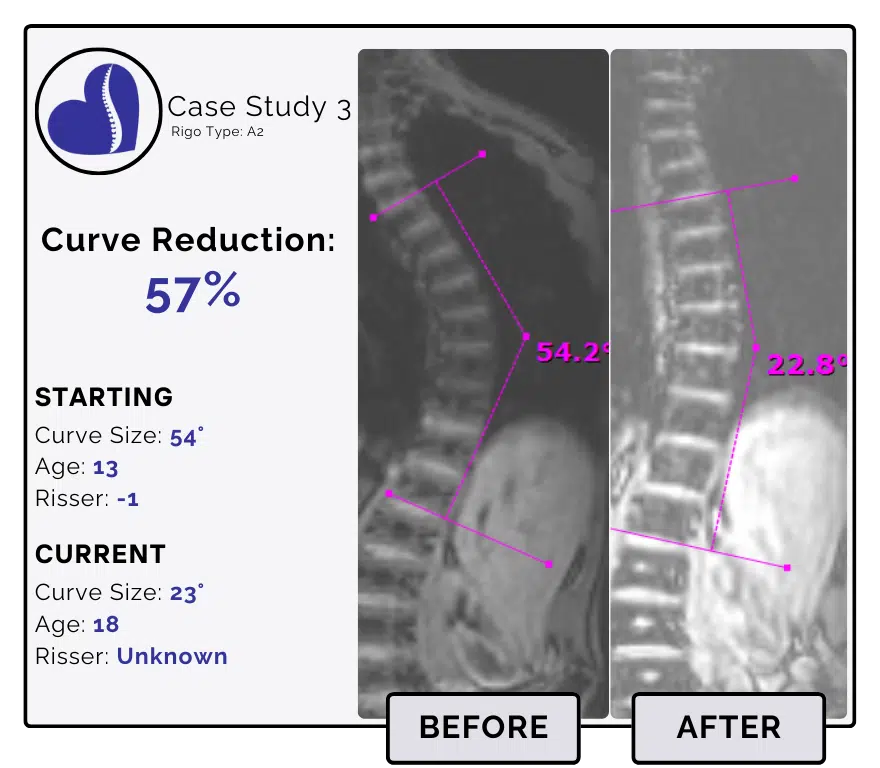
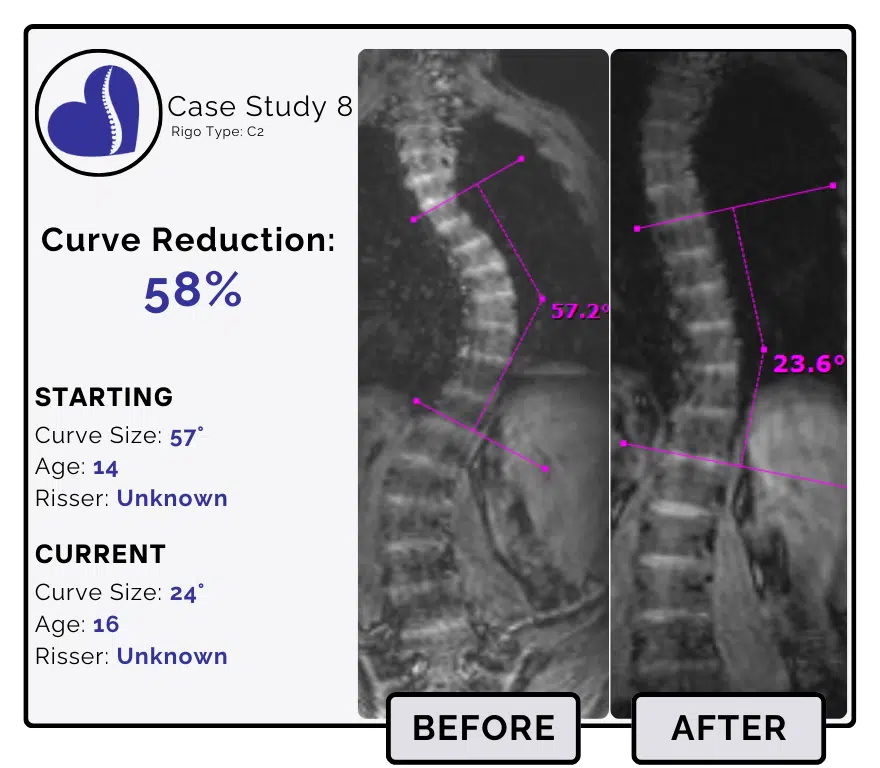
Before and after scoliosis treatment showing 57-degree curve reduction with detailed starting and current info, including percentage of curve reduction and comparison images.
Category: 65+°
Success Rate:
66%
Success Rate Defined:
– The percentage of cases in this category that were prevented from progressing further in surgical range
Average Reduction:
19%
Avg Reduction Defined:
– The average of ALL patients who started the program, not filtered for compliance. This includes patients who worked hard and those who did not
Our Best Reduction:
51%
Best Reduction Defined:
– Our largest percent reduction on record for cases that began with a Cobb Angle between 65+ degrees.
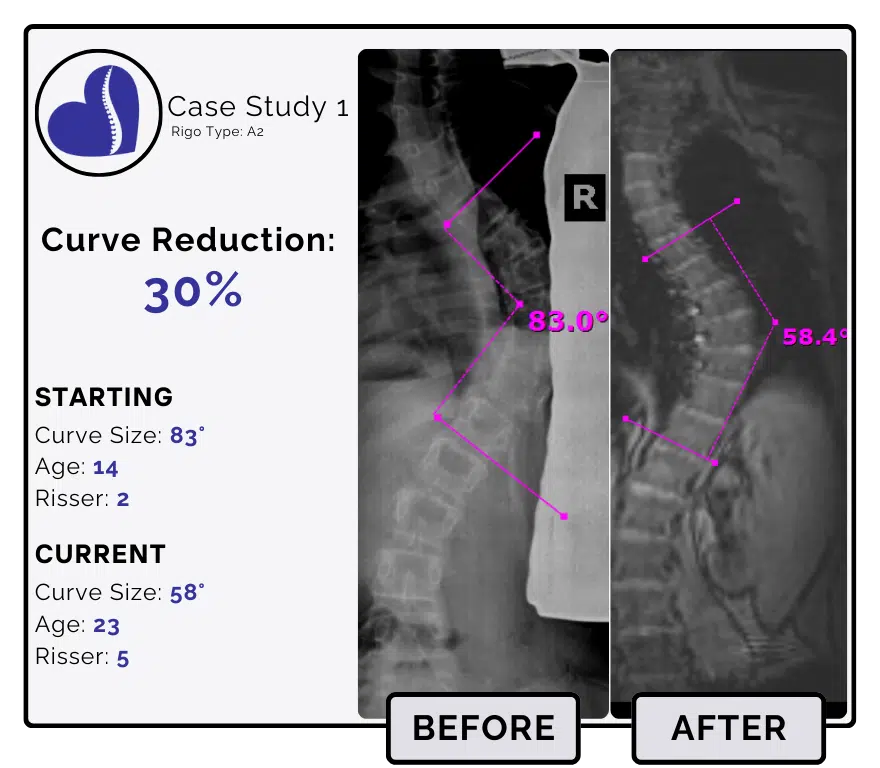
Before and after scoliosis treatment showing 83-degree curve reduction with detailed starting and current info, including percentage of curve reduction and comparison images.
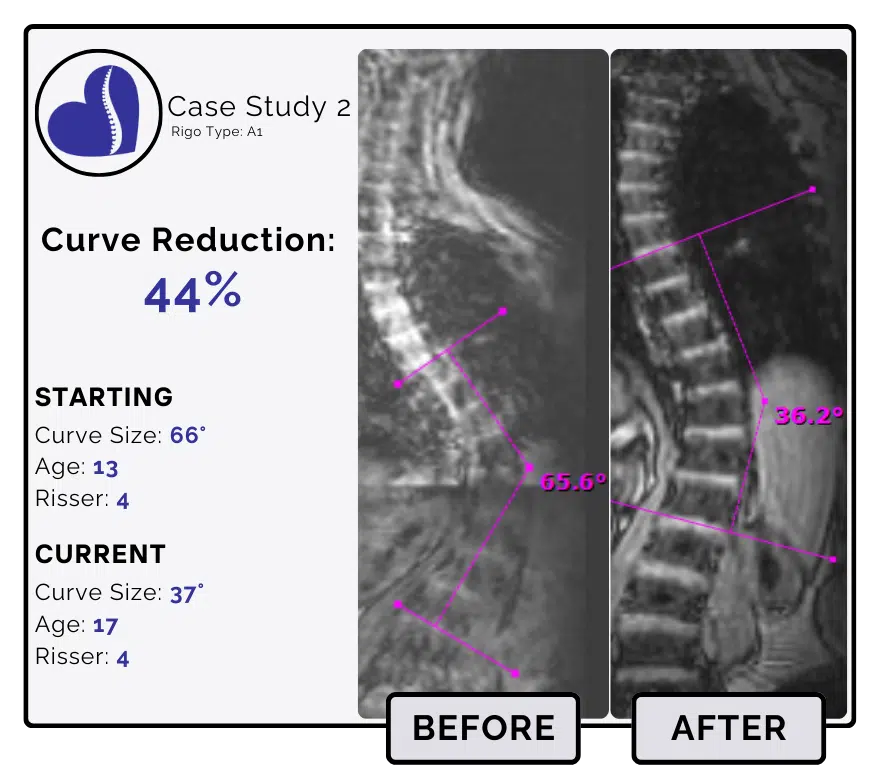
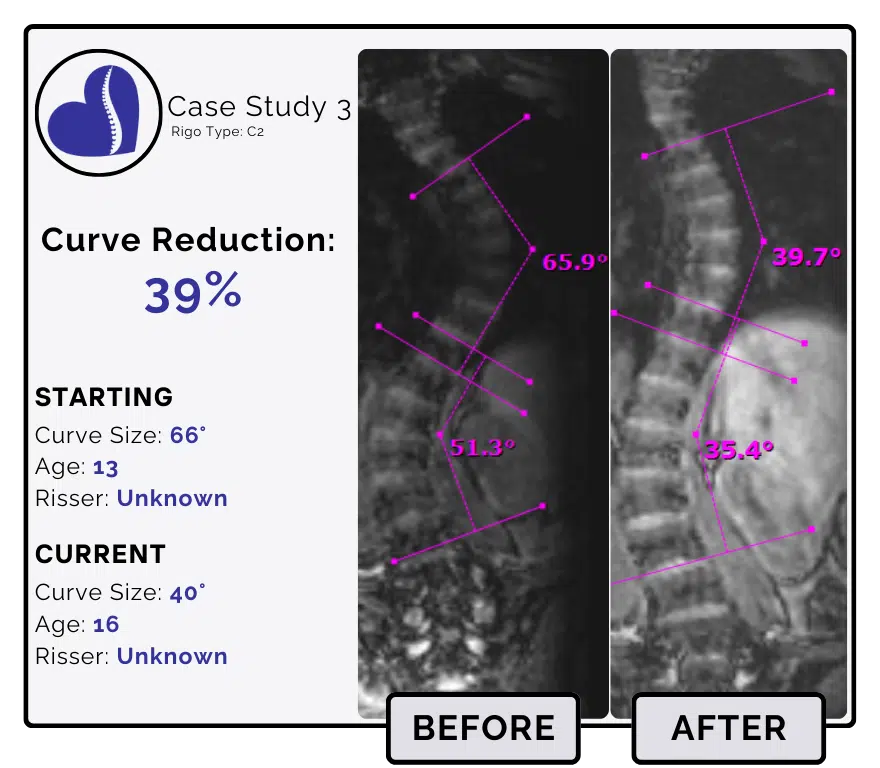
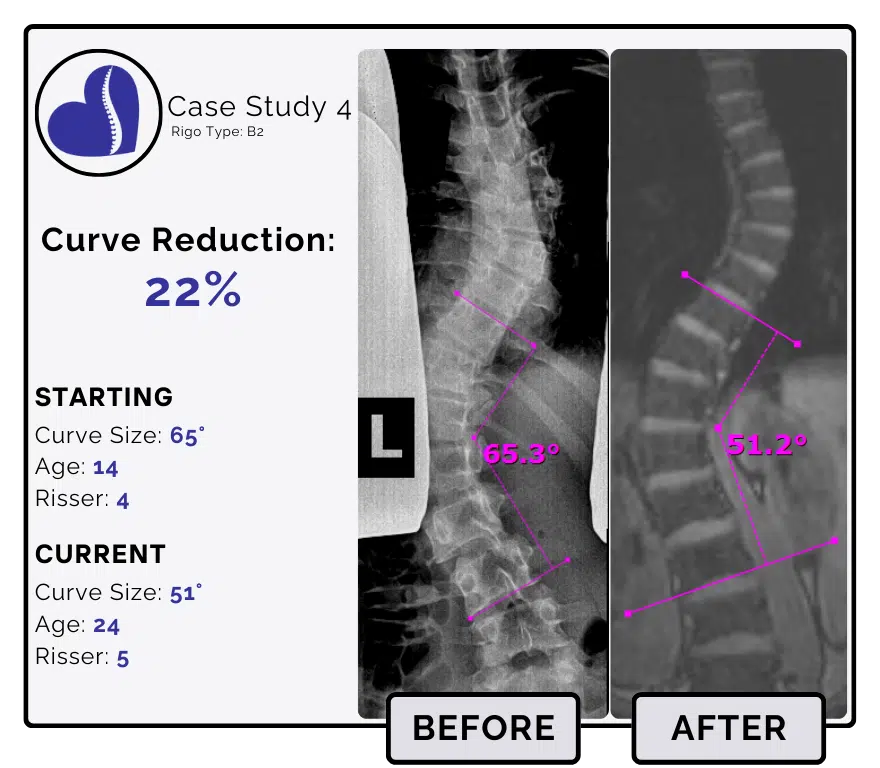
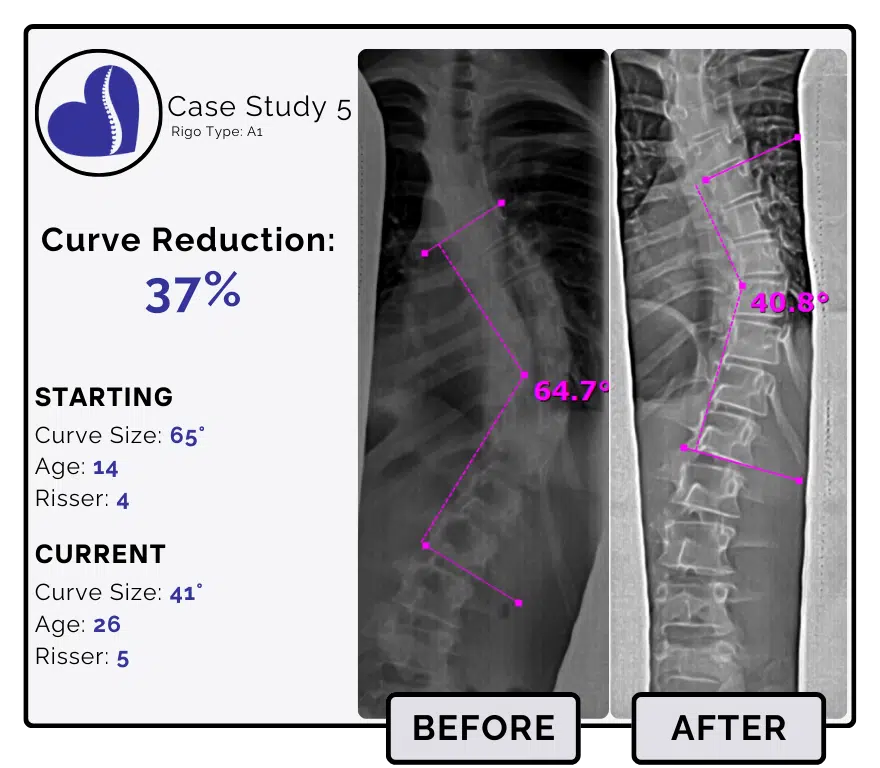
Before and after scoliosis treatment showing 66-degree curve reduction with detailed starting and current info, including percentage of curve reduction and comparison images.
Before and after scoliosis treatment showing 65-degree curve reduction with detailed starting and current info, including percentage of curve reduction and comparison images.

Key Concepts

  • Growth Stage: Early detection and treatment during a child’s growth phase can leverage natural growth to help correct the spine.
  • Duration of the Curve: The shorter the curve’s duration, the less “stuck” it is, leading to better outcomes with nonsurgical treatments.
  • Compliance: Following treatments and guidelines is crucial for successful outcomes.
  • Early Detection is Key: The earlier we identify and treat scoliosis, the better the chances for a successful outcome without surgery. This approach not only enhances the likelihood of a straight spine but also improves the chances for a happy and healthy adulthood.

Start by using our calculator to quickly assess the risk of scoliosis progression for your child. This tool, which relies on Lonstein et al.’s equation, takes into account three key factors: Cobb Angle, Risser Sign, and Age. Then, you can better understand your child’s unique situation.

Based on the most current research, you can estimate the likelihood that your child’s curve will progress to the point of requiring surgery. Additionally, our scoliosis surgical risk calculator will provide you with valuable insights, helping you to make informed decisions.